BCREA Housing Market Update for August 2020
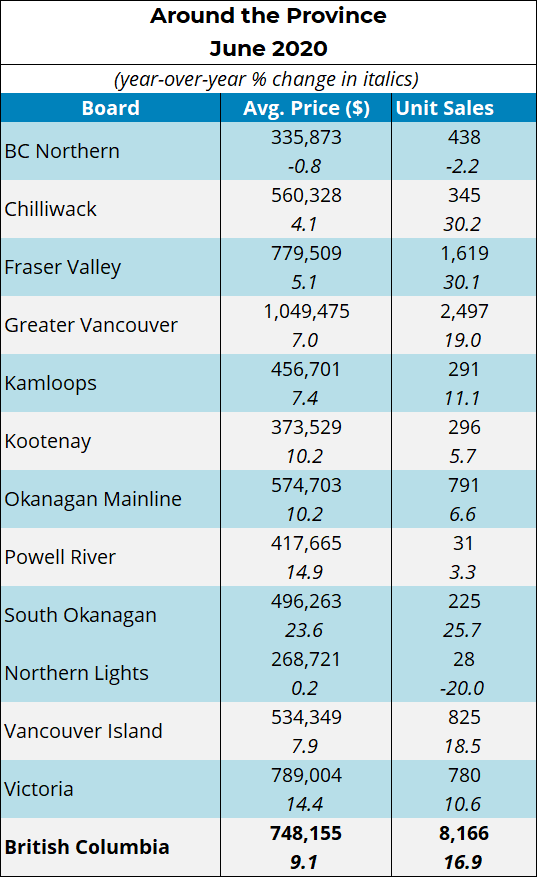
BCREA has posted it’s most recent Housing Market Update for BC for August 2020. In BC, sales posted a strong recovery across the province and for July went up above the pre-covid the levels. Active listings remain down and there is high demand for single family homes in most markets. With low supply the market sits in the Seller’s market territory. Heightened demand for single family homes as forced prices of homes higher.
In Kamloops there were 340 unit sales in July 2020, that is a 15.6% increase year over year. The average price is also up 6.7% over last year. There is also a 21% decrease in the number of active listings in Kamloops year over year with 1,028 homes on the market.
Click here to visit to BCREA’s website. To view other statistics for the Kamloops and BC real estate market click here.
If you want to be kept informed on Kamloops Real Estate, News and more visit our Facebook Page.
To search for Kamloops real estate and homes for sale click here.