BCREA: Rising Mortgage Rates Continue to Slow Market Activity
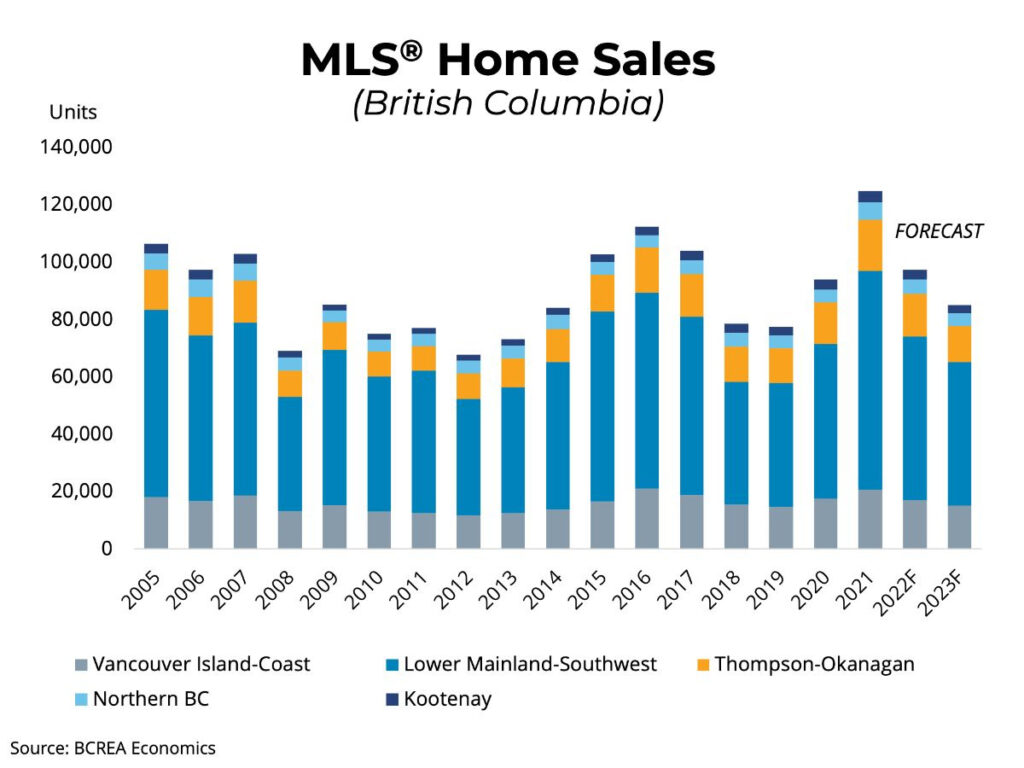
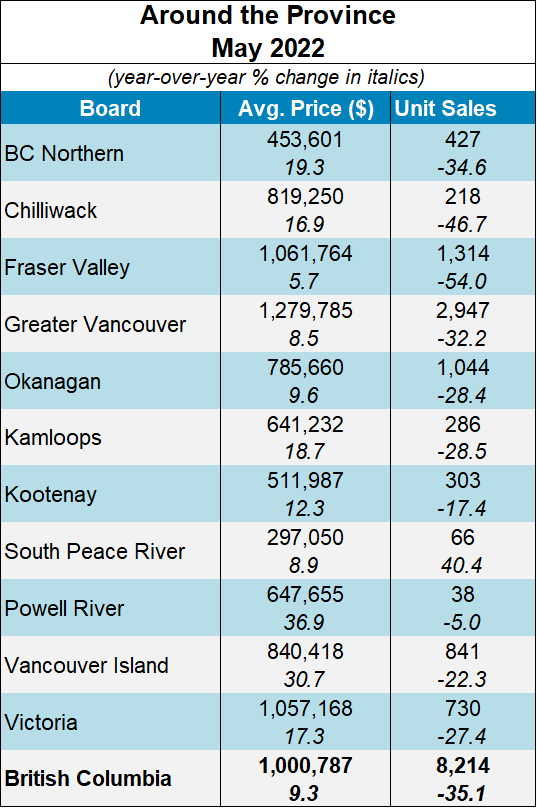
Vancouver, BC – June 13, 2022. The British Columbia Real Estate Association (BCREA) reports that a total of 8,214 residential unit sales were recorded by the Multiple Listing Service® (MLS®) in May 2022, a decrease of 35.1 per cent from May 2021. The average MLS® residential price in BC was $1 million, a 9.3 per cent increase from $915,392 recorded in May 2021. Total sales dollar volume was $8.2 billion, a 29.1 per cent decline from the same time last year.
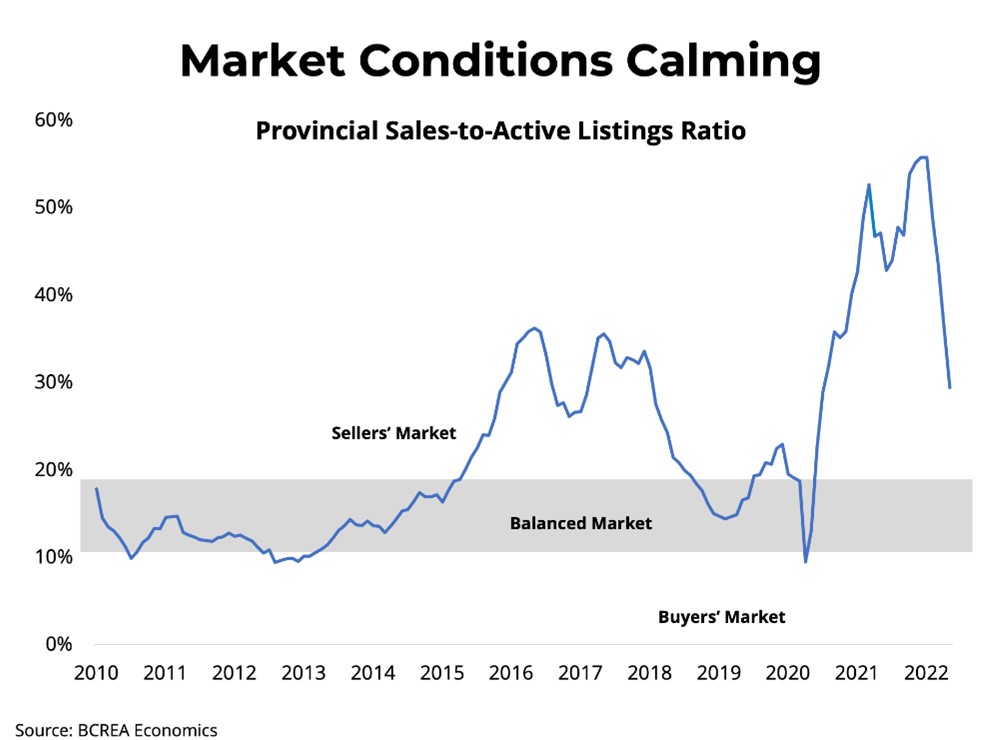
“Canadian mortgage rates continue to climb,” said BCREA Chief Economist Brendon Ogmundson. “The average 5-year fixed mortgage rate reached 4.49 per cent in June. That is the highest mortgage rates have been since 2009.”
Provincial active listings were 4.4 per cent higher than this time last year, the first year-over-year increase in active listings since 2019. However, active listings still remain below what is typical for a balanced market, though current market conditions have a high degree of variation across regions and product types.
Year-to-date, BC residential sales dollar volume was down 14.5 per cent to $46.7 billion, compared with the same period in 2021. Residential unit sales were down 26.3 per cent to 43,921 units, while the average MLS® residential price was up 16 per cent to $1.06 million.
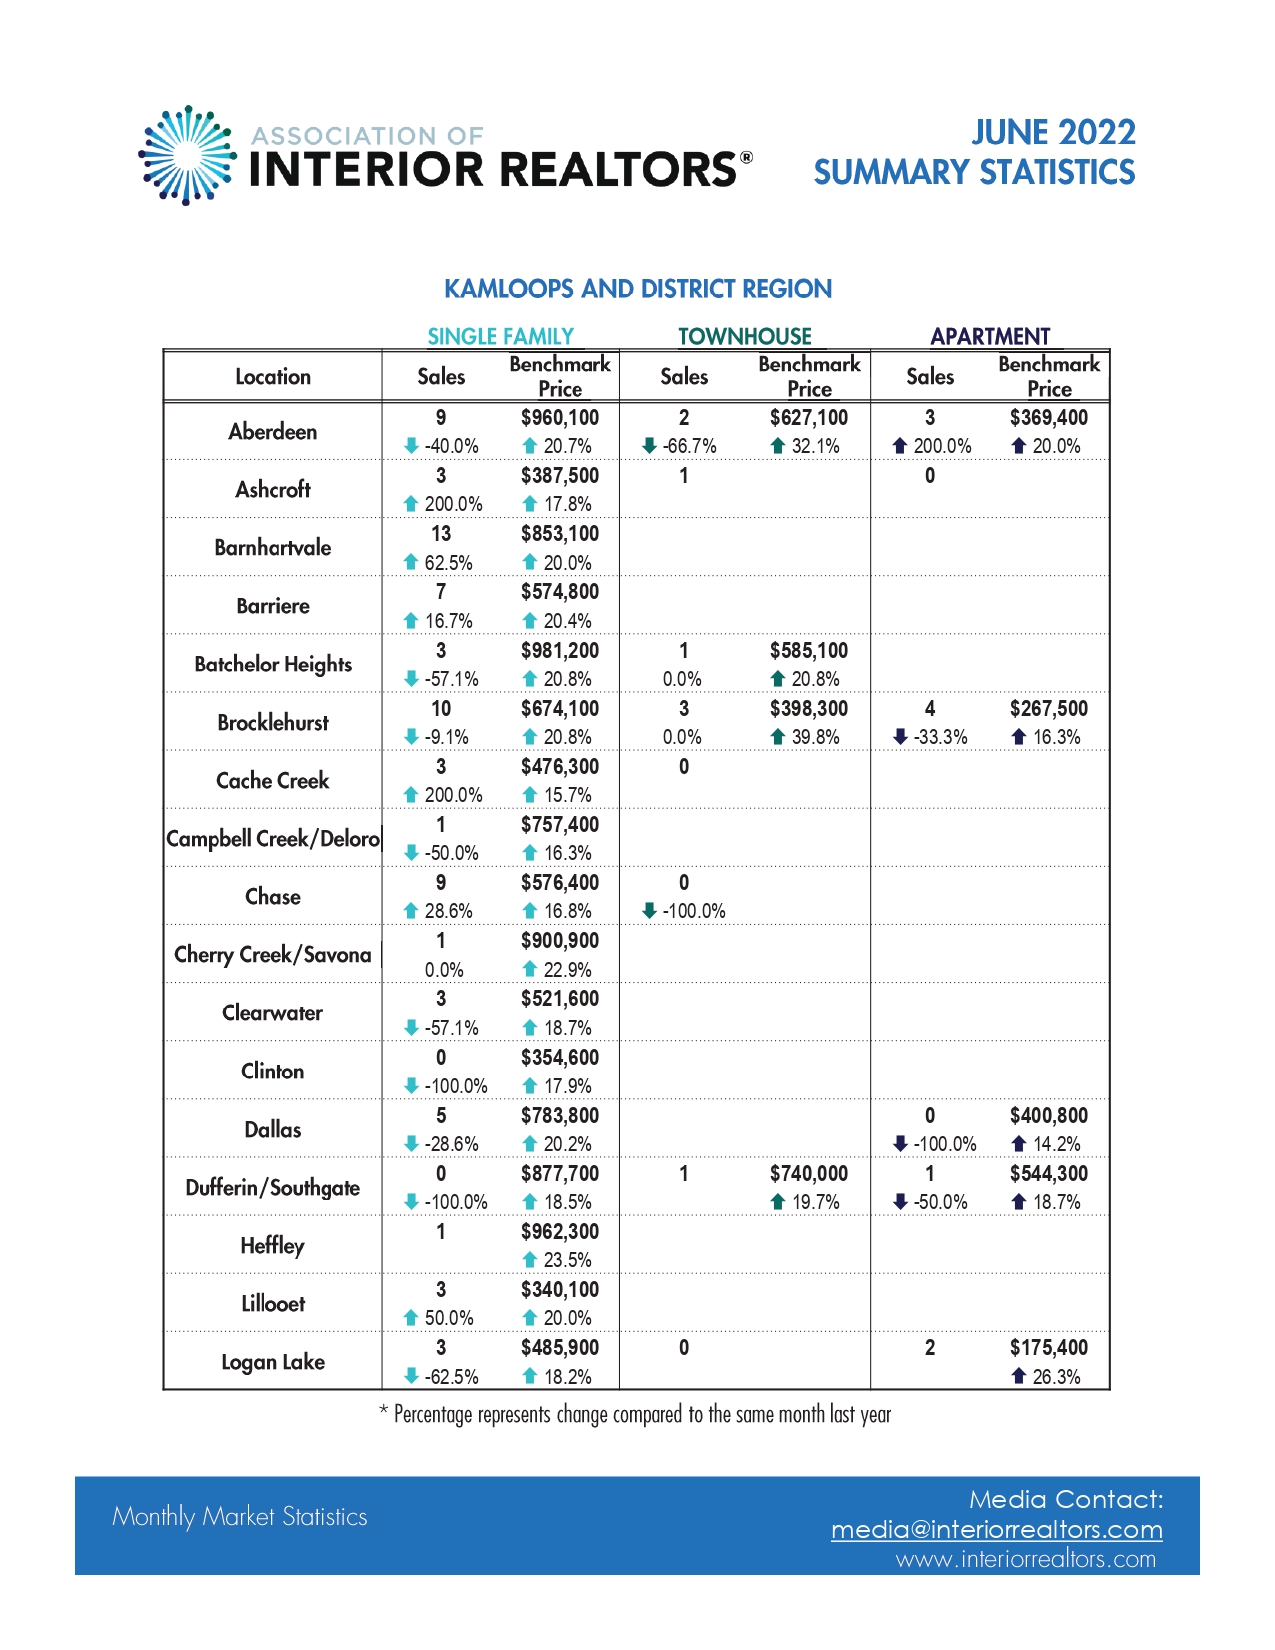
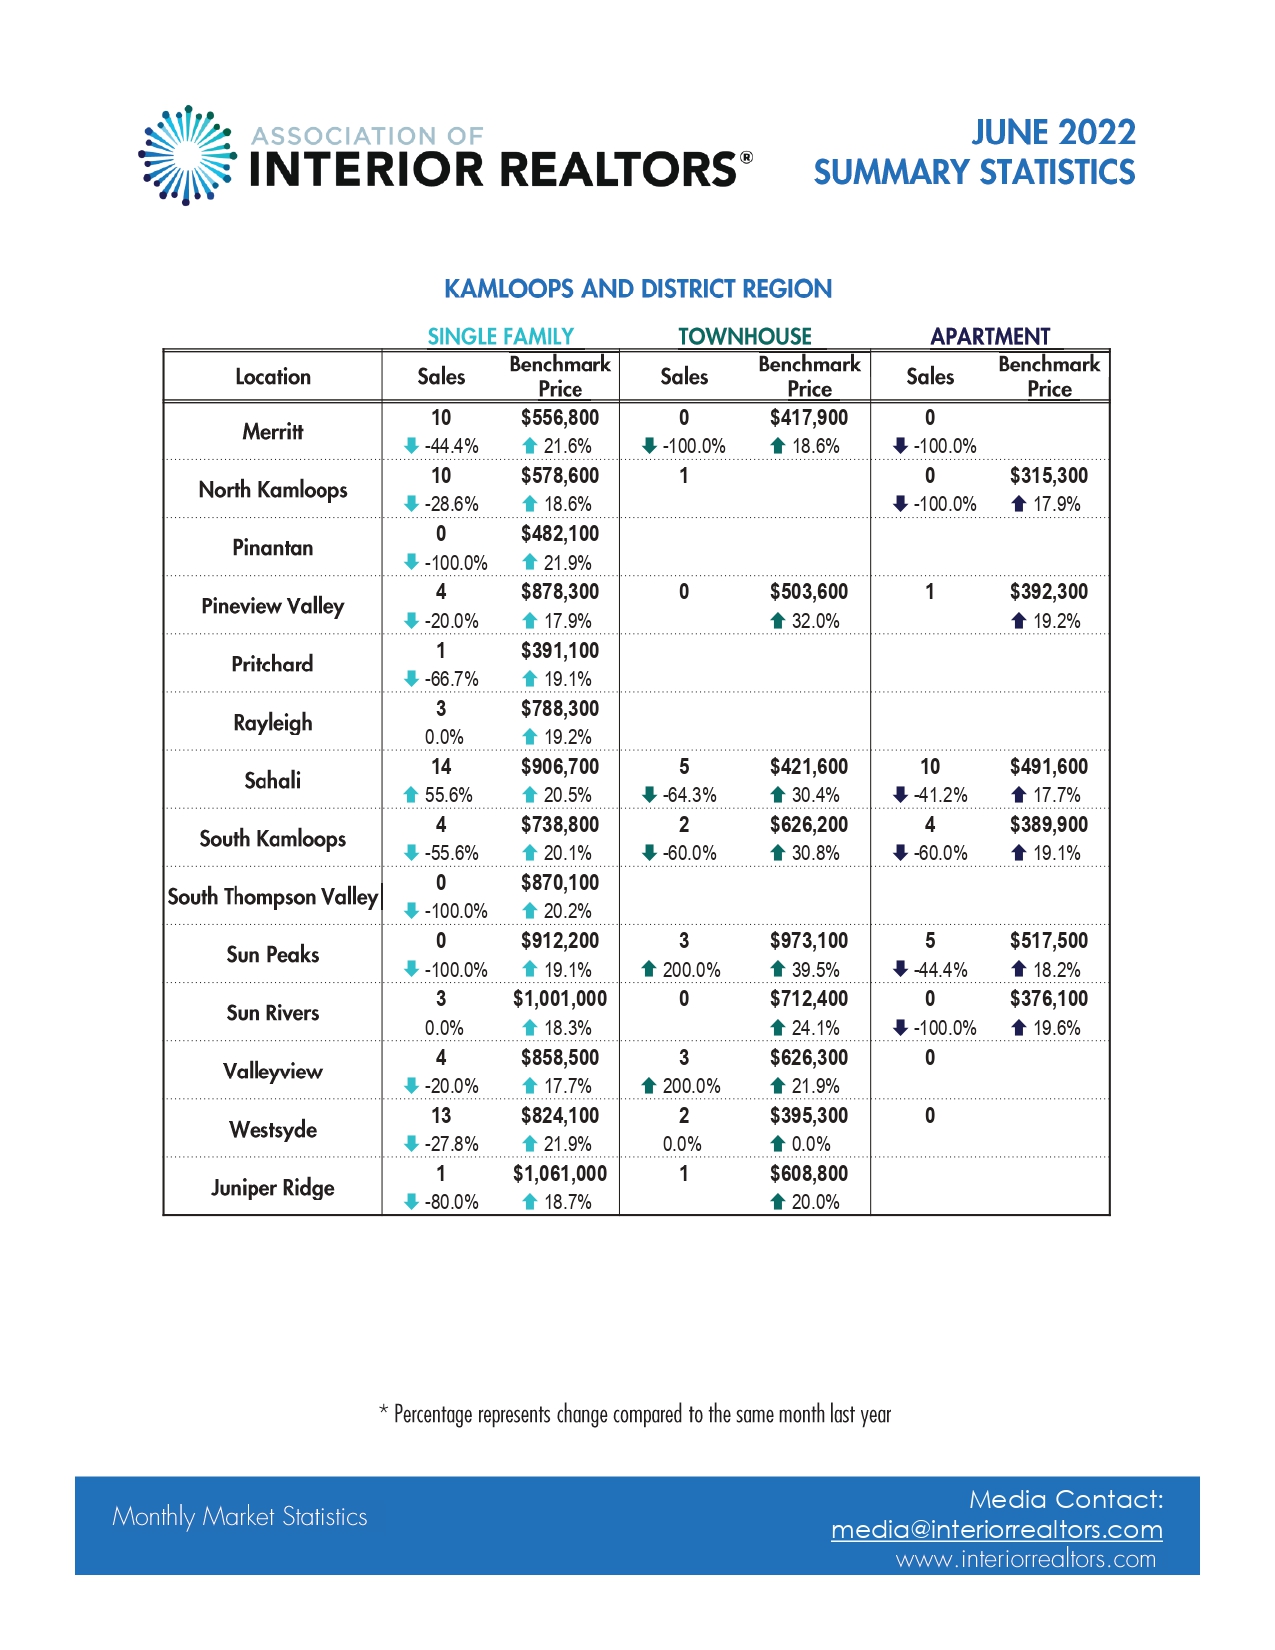
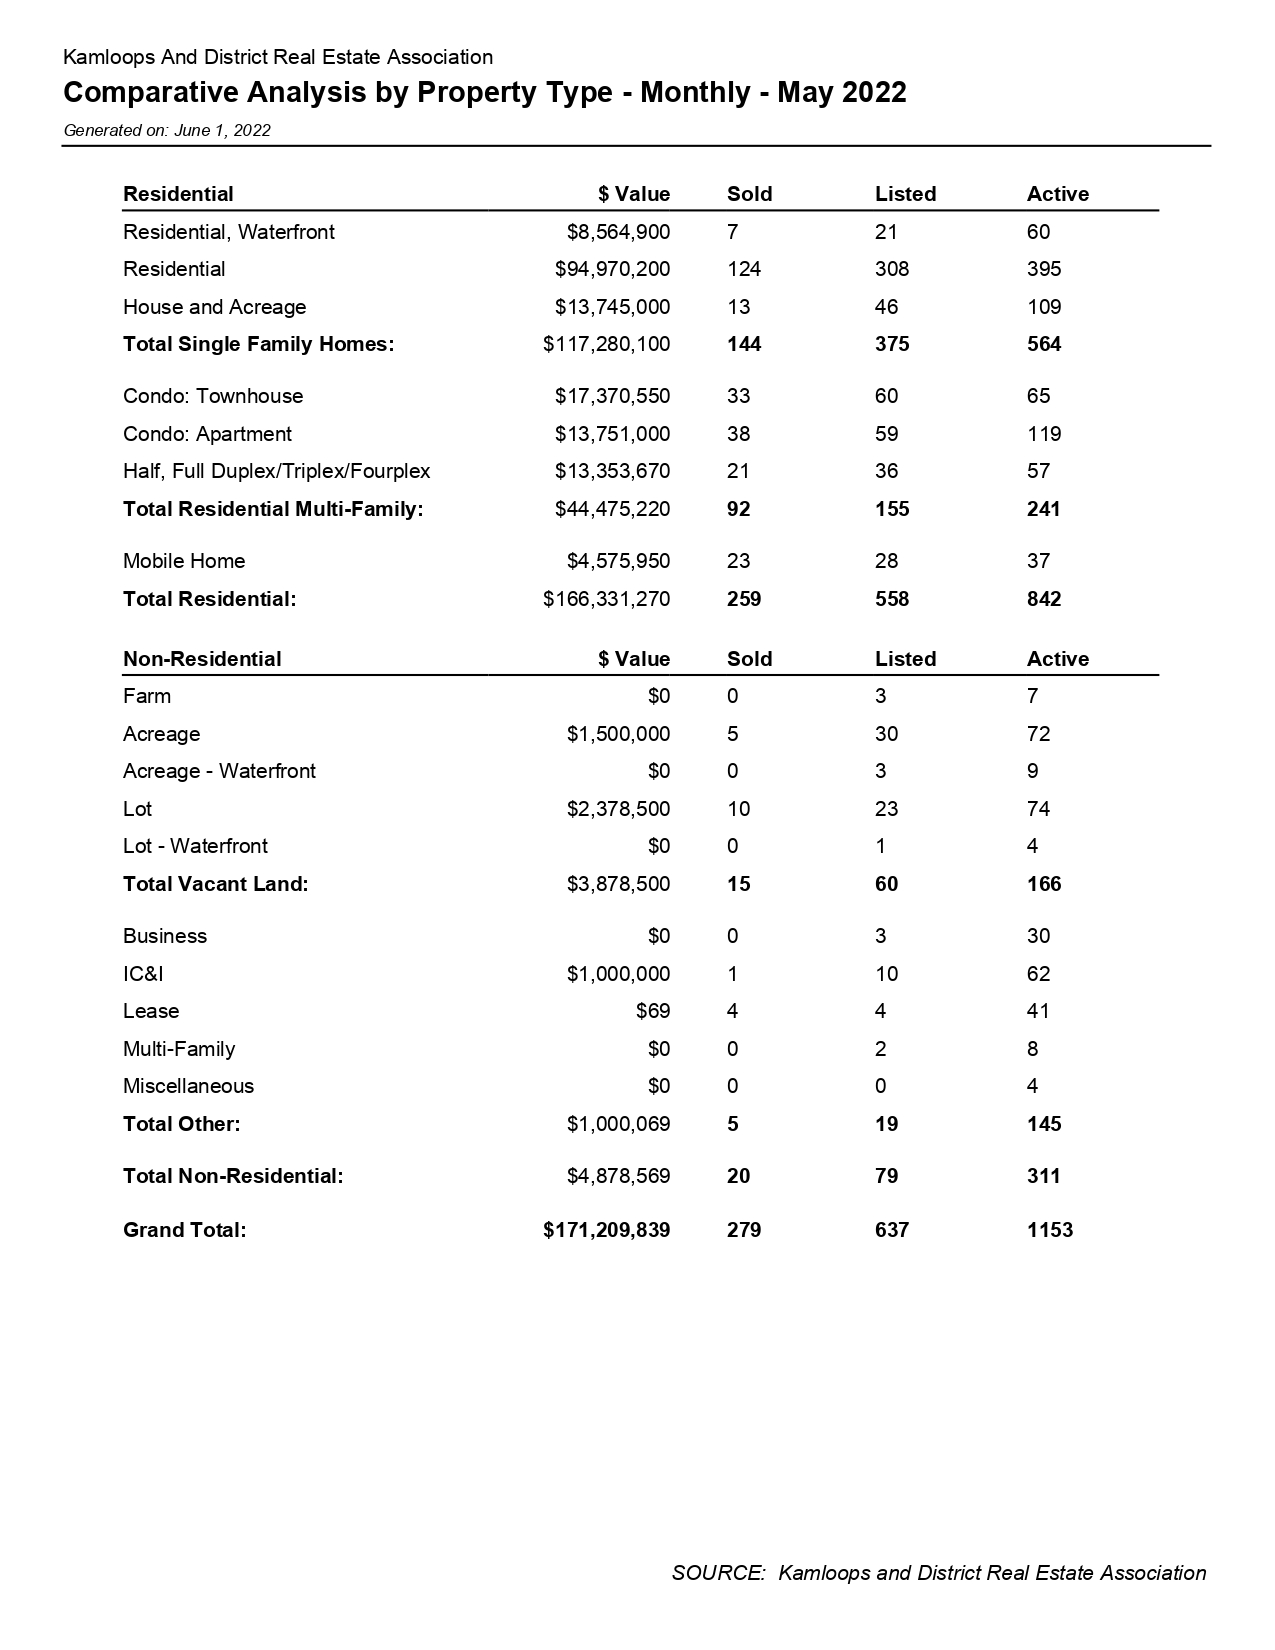
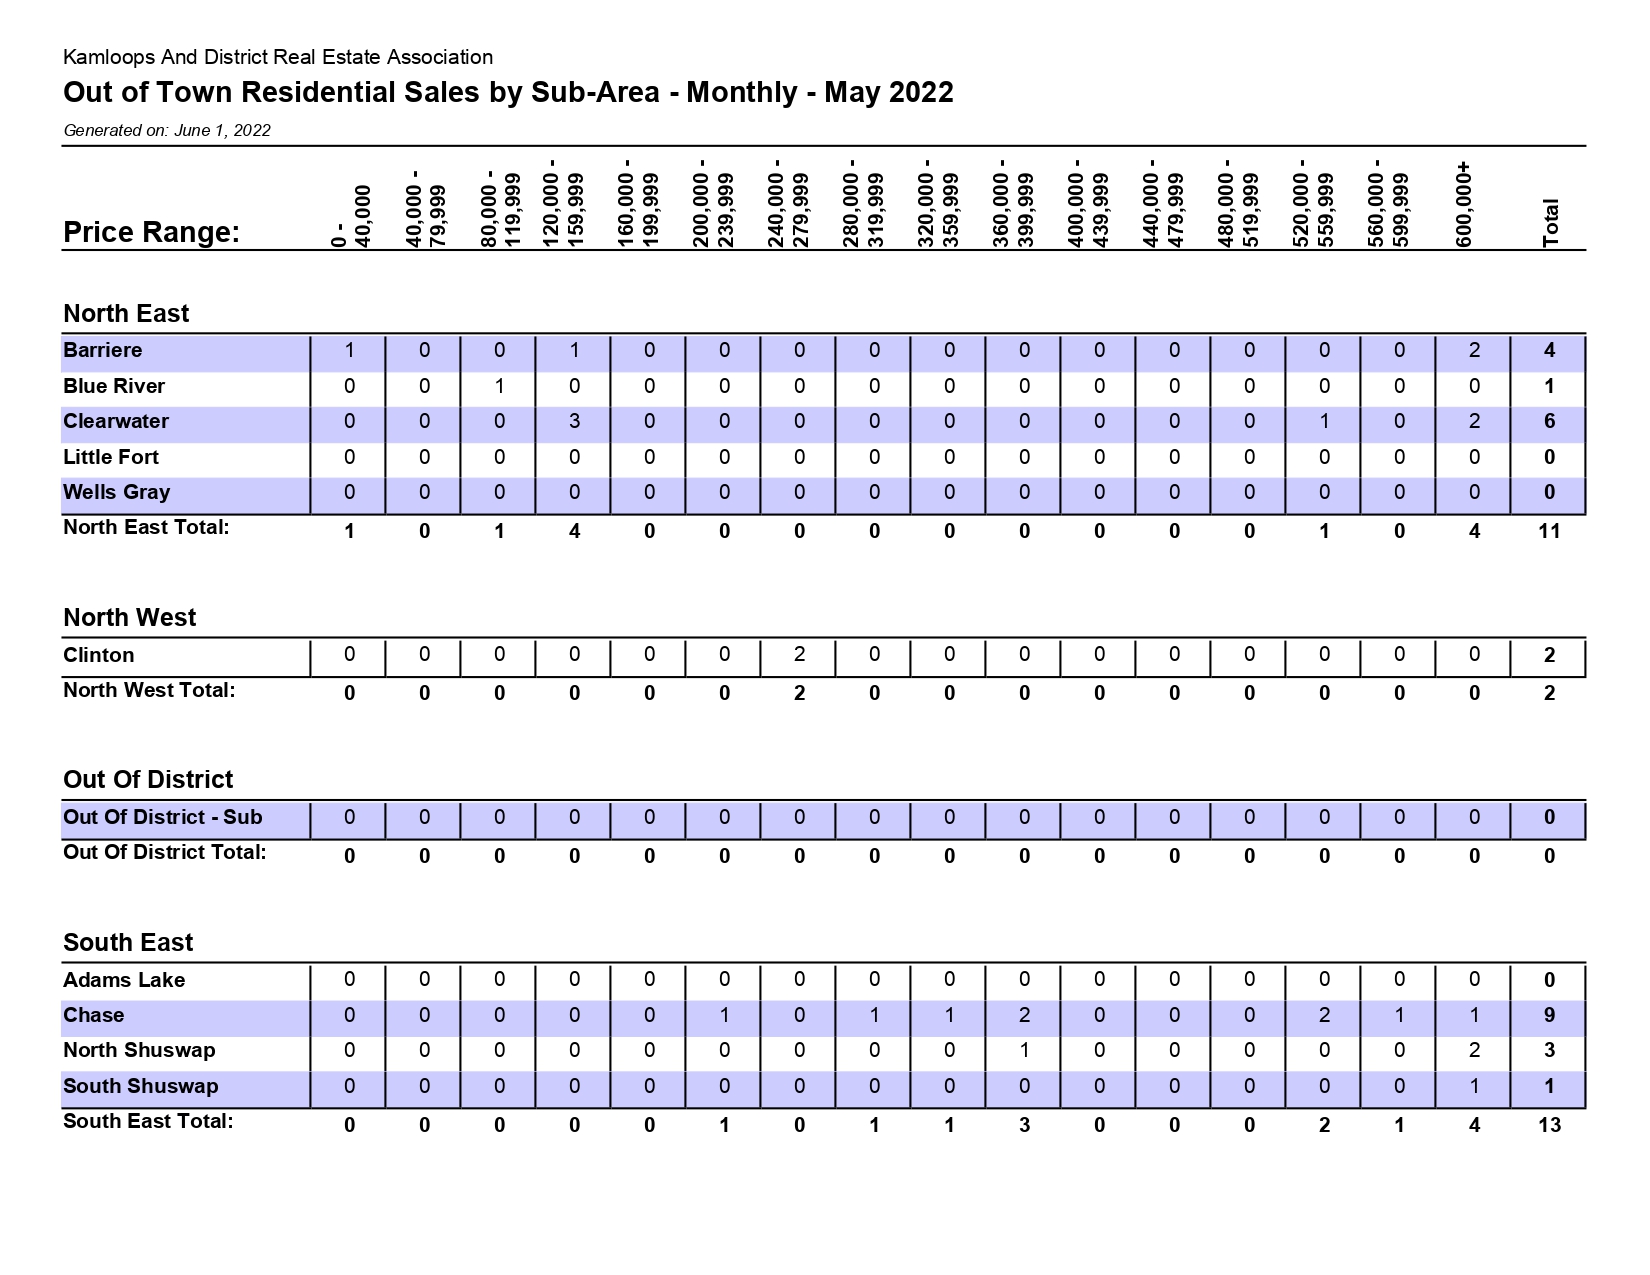
Click here to visit to BCREA’s website. To view other statistics for the Kamloops and BC real estate market click here.
If you want to be kept informed on Kamloops Real Estate, News and more visit our Facebook Page.
To search for Kamloops real estate and homes for sale click here.