Housing Markets Flat in 2019 After Strong Second Half, BCREA
Vancouver, BC – January 13, 2020. The British Columbia Real Estate Association (BCREA) reports that a total of 77,331 residential unit sales were recorded by the Multiple Listing Service® (MLS®) in 2019, a decline of 1.5 per cent from the 78,516 units sold in 2018. The annual average MLS® residential price in BC was $700,460, a decline of 1.6 per cent from $711,564 recorded the previous year. Total sales dollar volume was $54.2 billion, a 3 per cent decline from 2018.
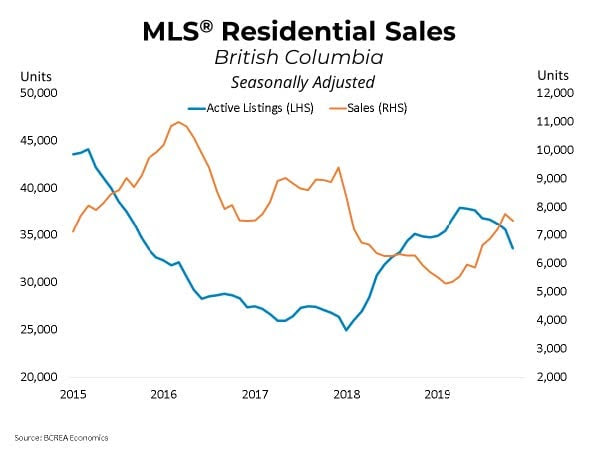
“Housing markets across the province staged a strong recovery in the second half of 2019,” said BCREA Chief Economist Brendon Ogmundson. “This sets up 2020 to be a much more typical year than what markets have experienced recently.”
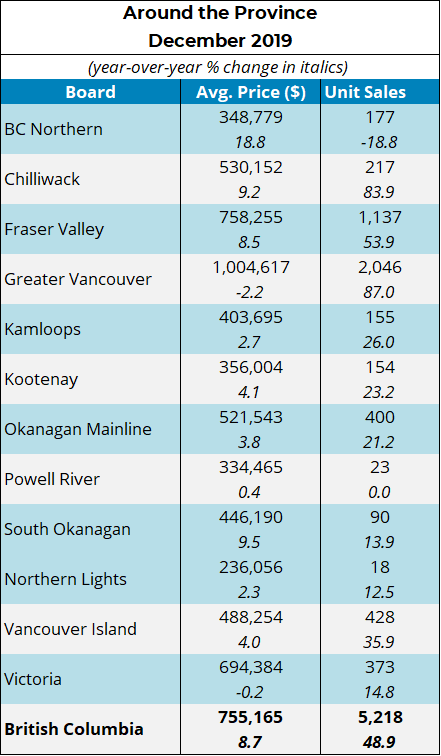
A total of 5,218 MLS® residential unit sales were recorded across the province in December, up 48.9 per cent from December 2018. The average MLS® residential price in BC was $755,165, an increase of 8.7 per cent from December 2018. Total sales dollar volume was $3.9 billion, a 61.8 per cent increase year-over-year.
Total active residential listings were down 10.6 per cent to 24,691 units in December. Total inventory of homes for sale have declined more than 10 per cent on a year-over-year basis for two straight months.
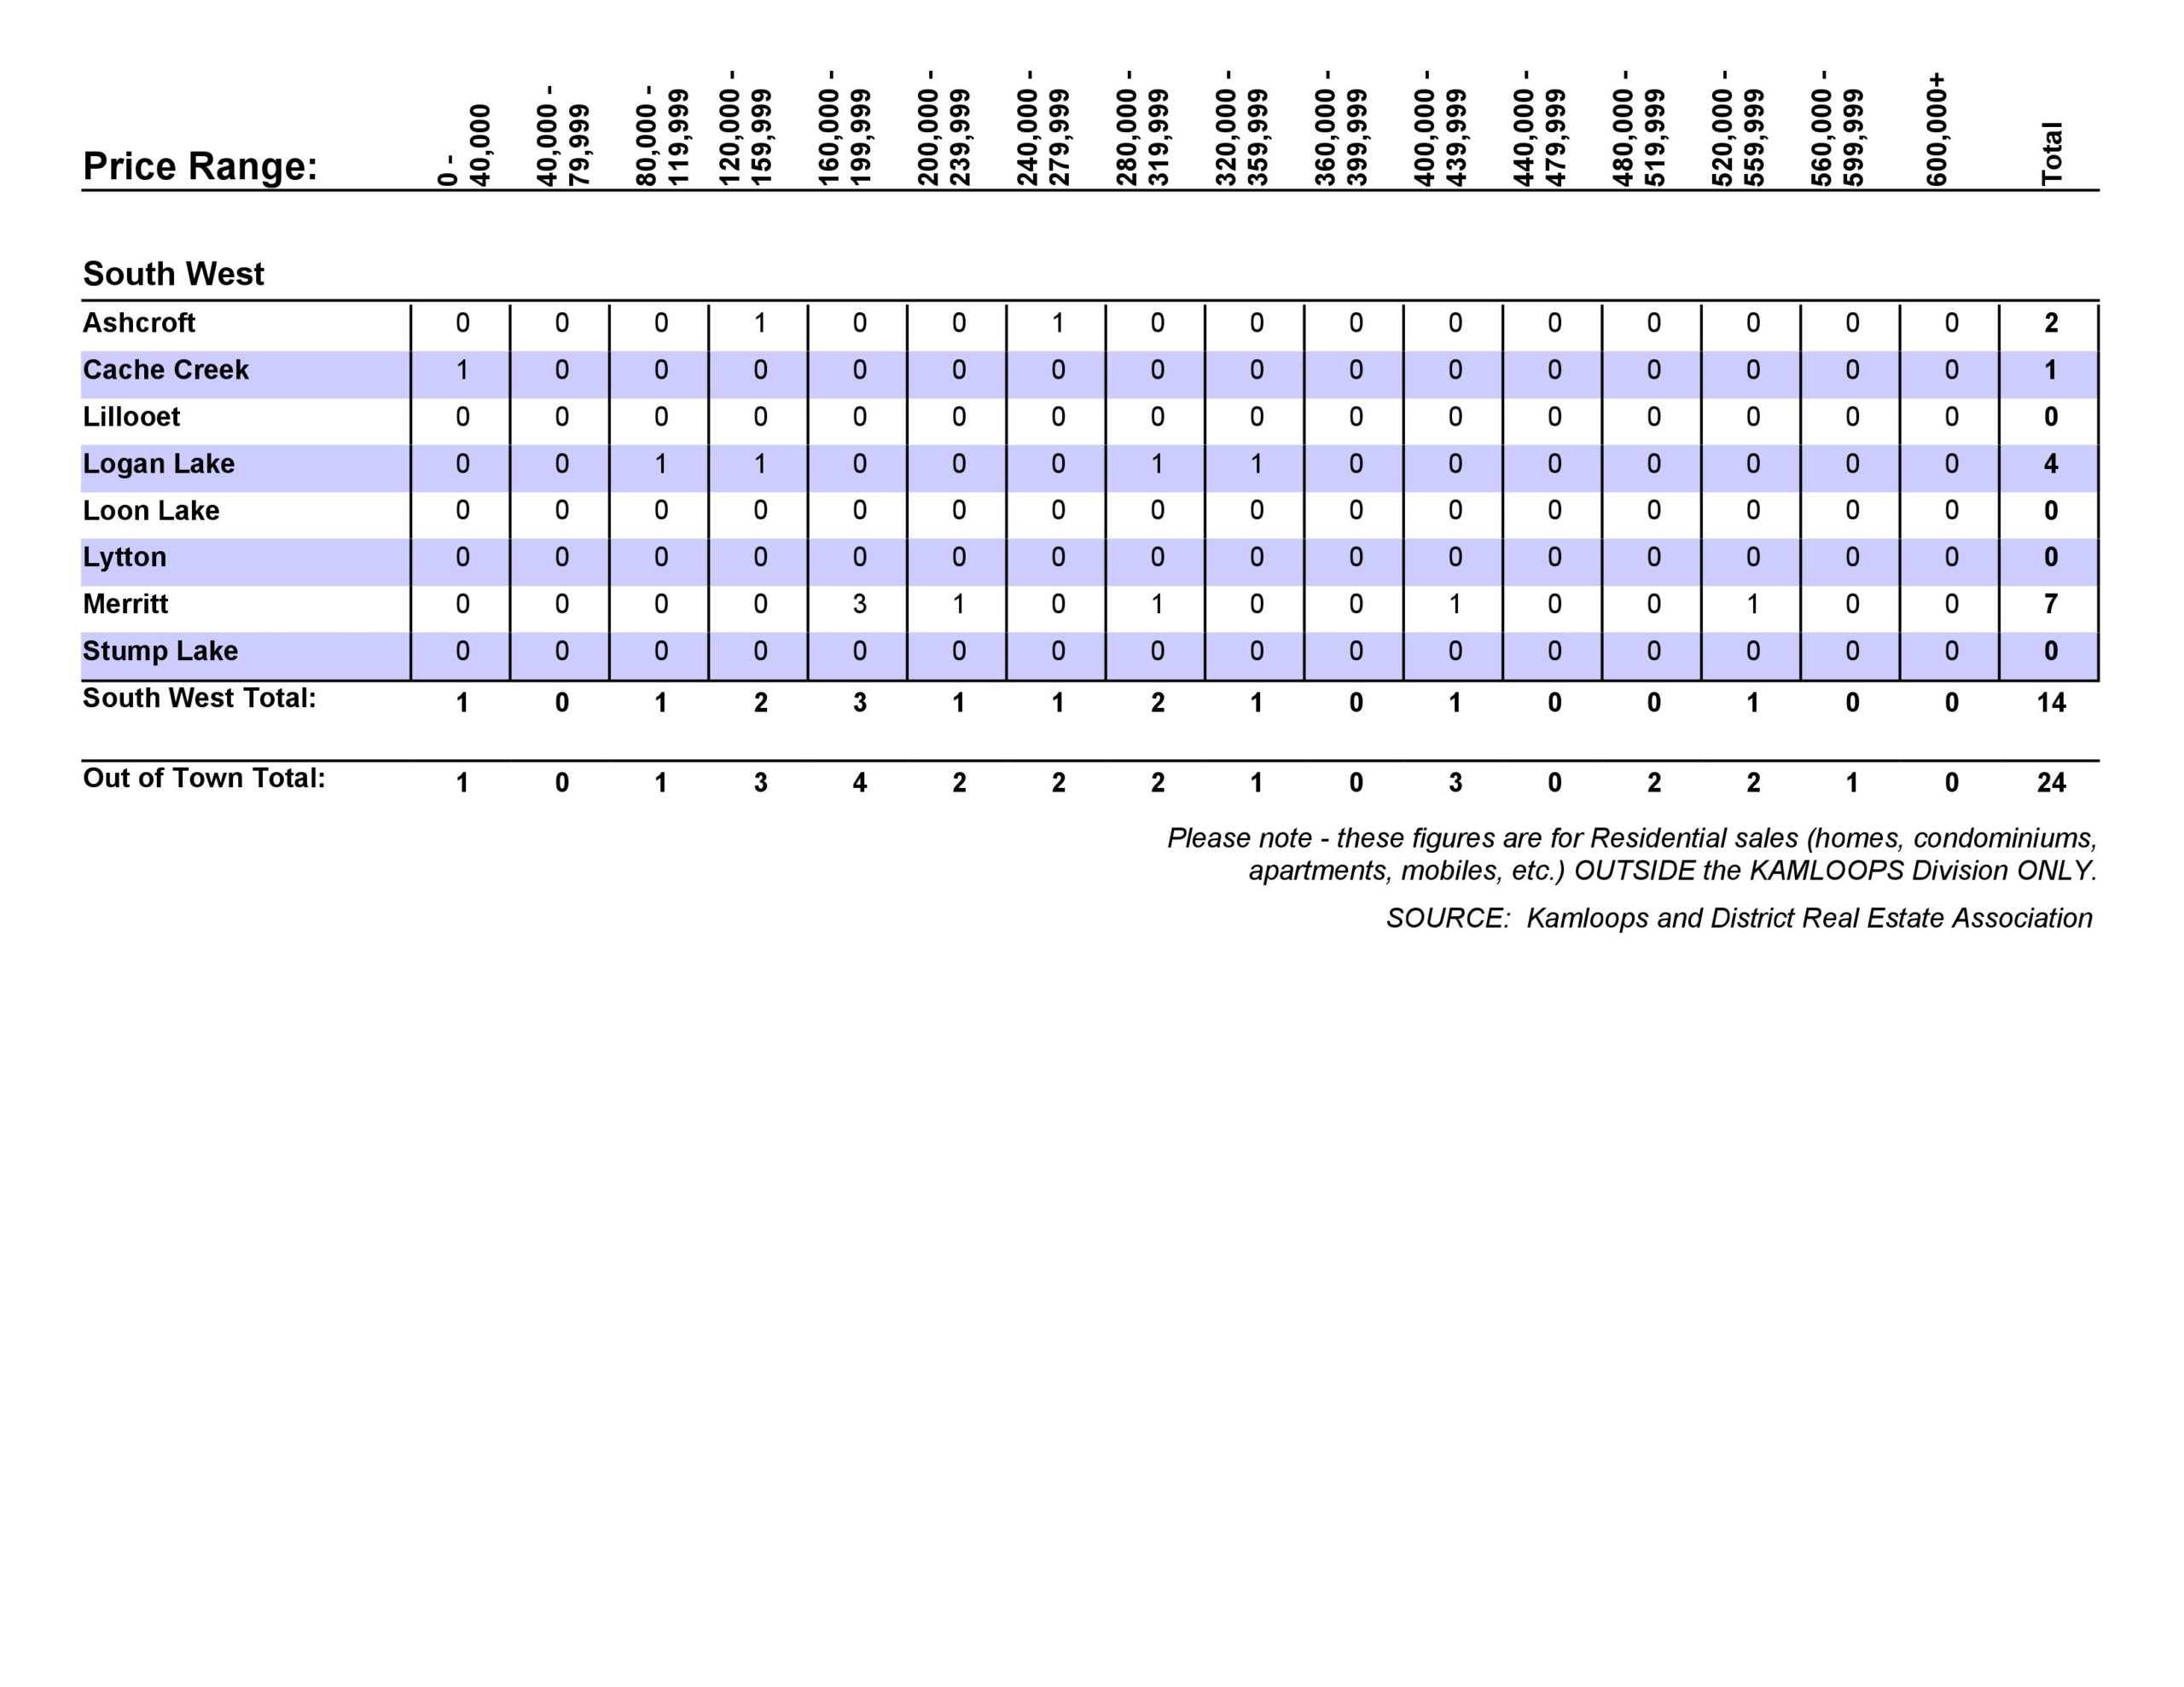
Click here to visit to BCREA’s website. To view other statistics for the Kamloops and BC real estate market click here.