BCREA Housing Market Update for December 2019
The BC Real Estate Association (BCREA) released the latest housing market update for December 2019 which discusses the November 2019 statistics.
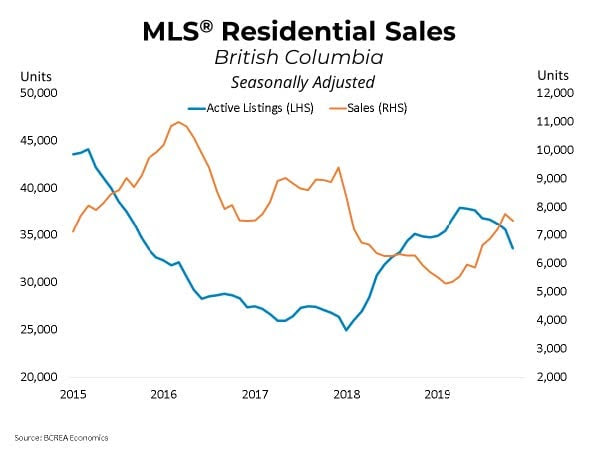
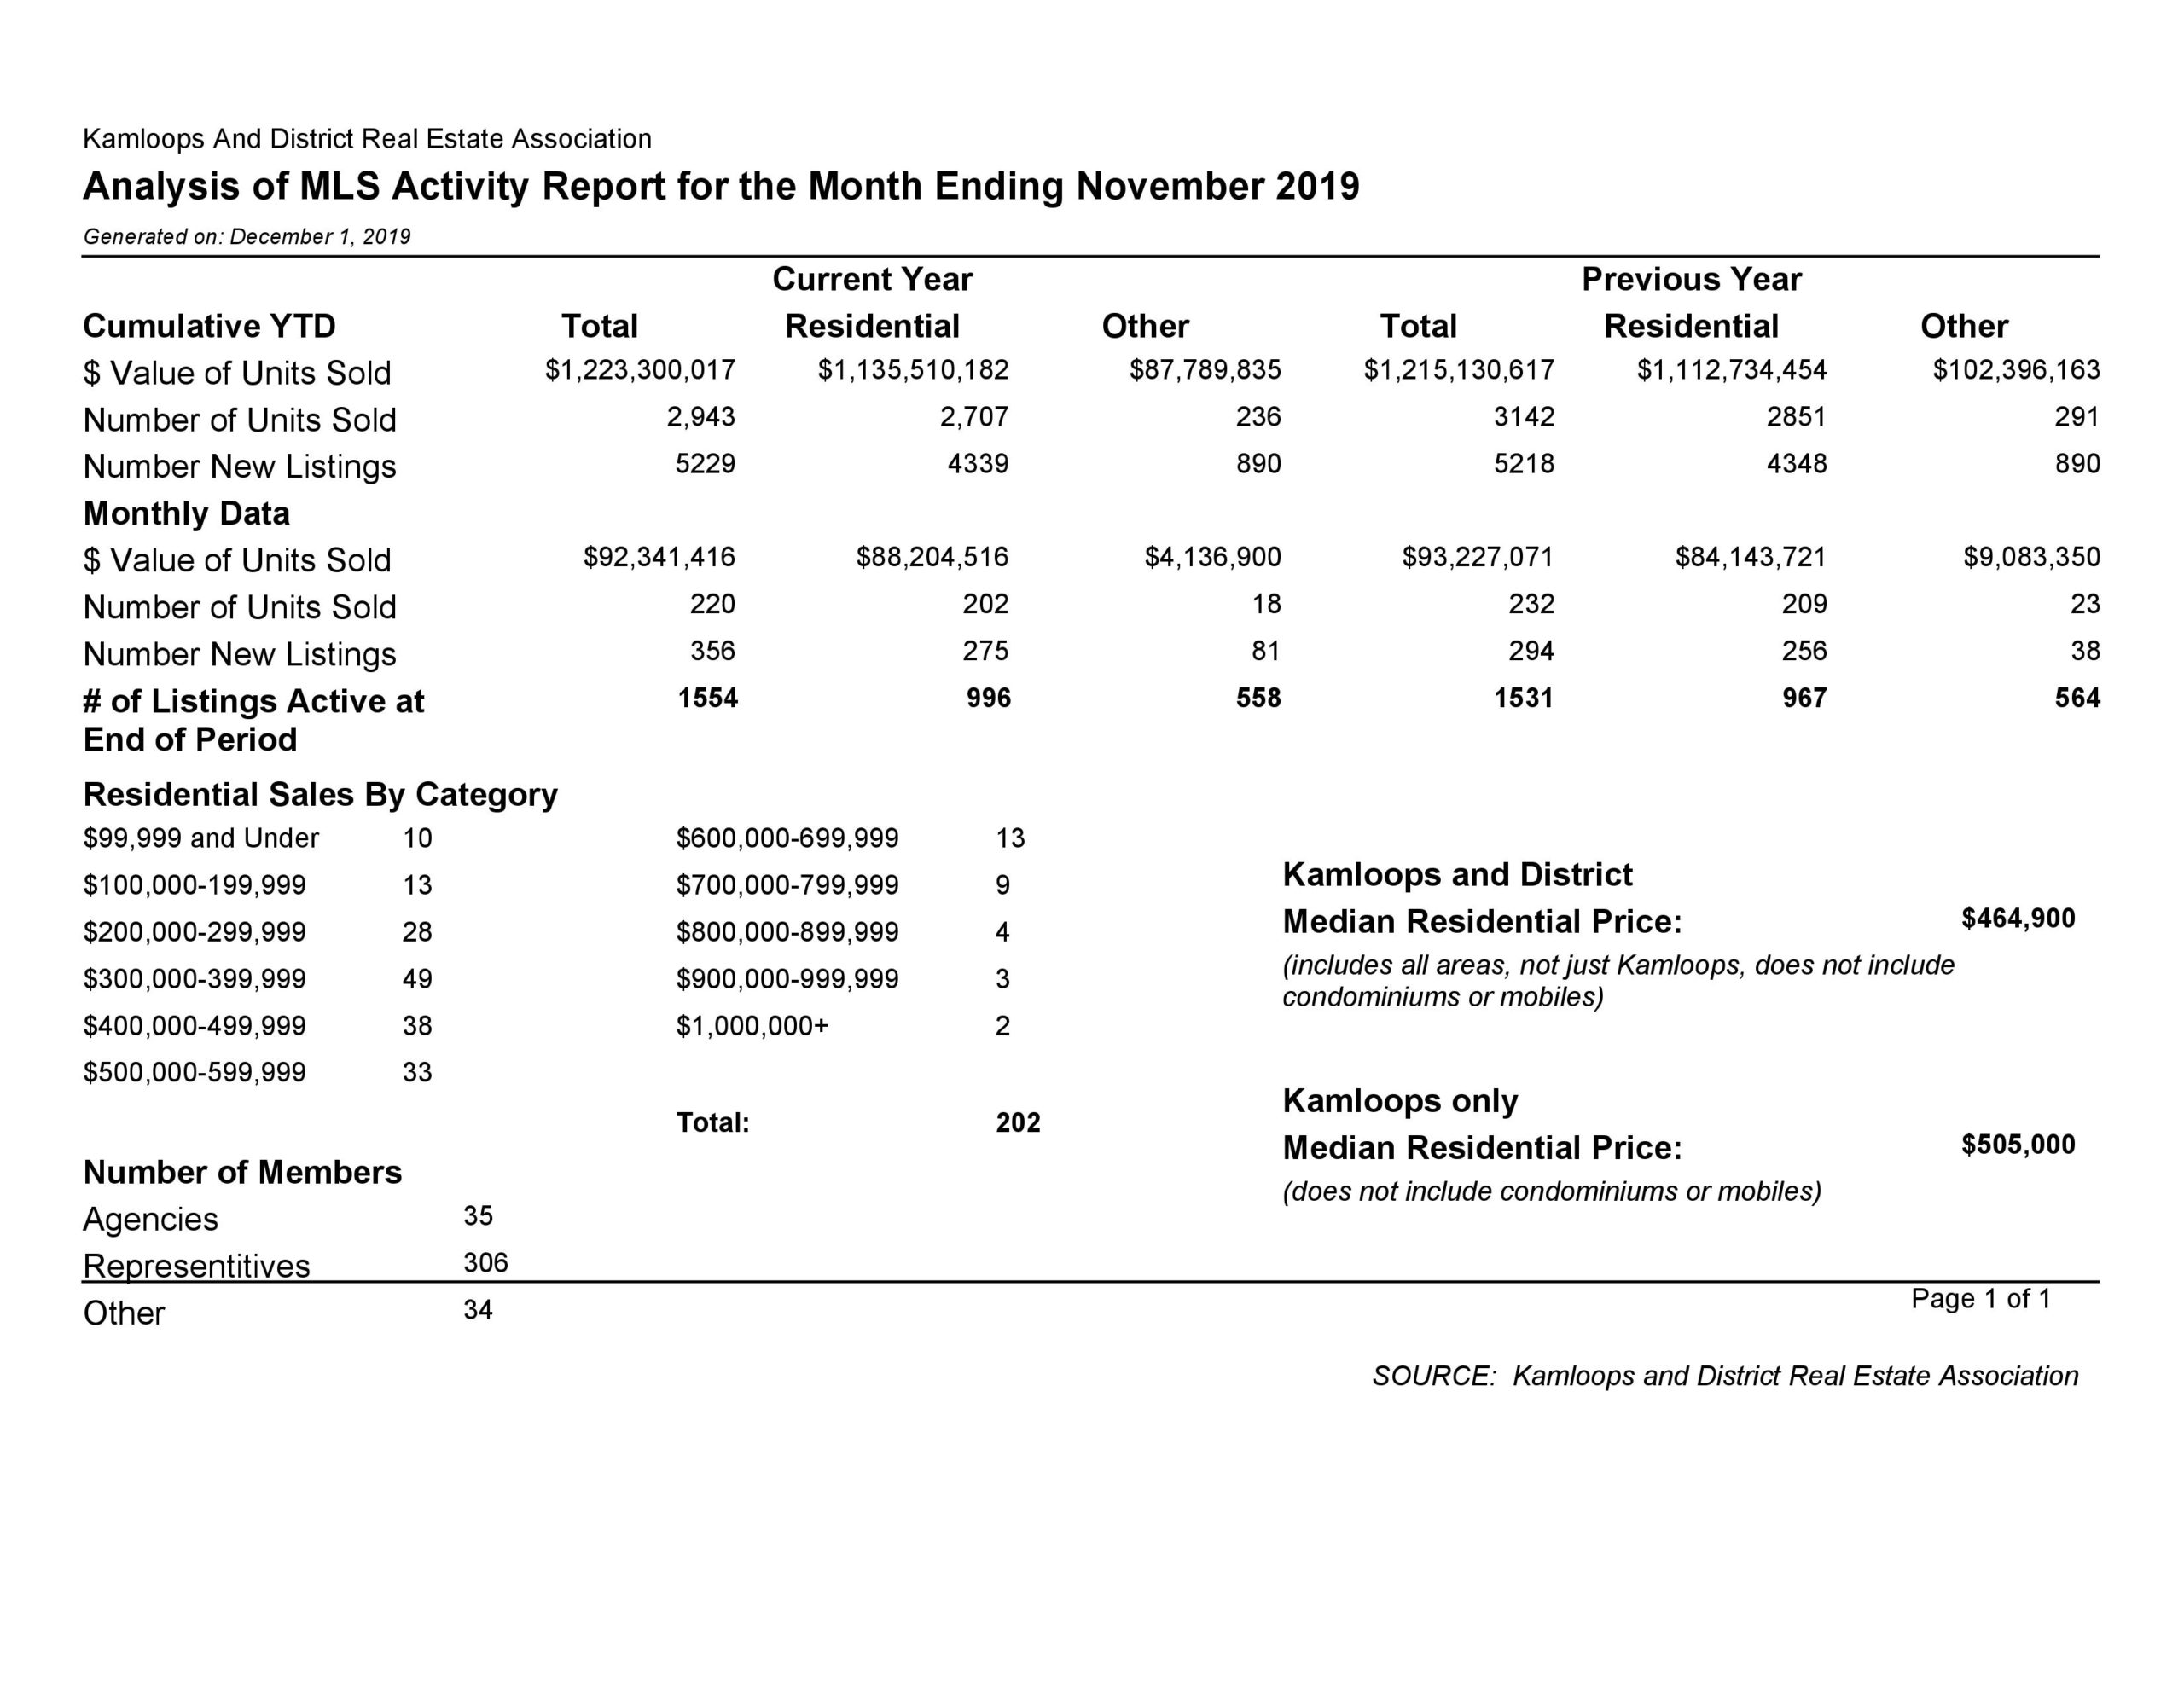
For Kamloops the housing market in November we saw a 4.3% decrease in the number of sales year over year. Kamloops did however see an average price increase of 7.7% resulting in an average price of $436,656. At the end of November there were 996 active listings in the Kamloops district which is an increase of 3% over last year. This translates to 4.9 months worth of supply of homes on the market. The Kamloops housing market is ultimately still doing well in comparison to other comparable market areas.
Click here to visit to BCREA’s website. To view the November 2019 market update click here.