Vancouver, BC – January 12, 2017. The British Columbia Real Estate Association (BCREA) reports that a total of 103,763 residential unit sales were recorded by the Multiple Listing Service® (MLS®) across the province in 2017, a decline of 7.5 per cent from a record 112,211 unit sales in 2016. The average MLS® residential price in BC was $709,579 in 2017, up 2.7 per cent from the previous year. Total sales dollar volume was $73.63 billion, down 5.1 per cent from 2016.
“Robust housing demand in 2017 was underpinned by a strong economy, employment growth and rising wages,” said Cameron Muir, BCREA Chief Economist. “Above trend migration, both international and interprovincial, also bolstered housing demand, while broader demographic fundamentals added fuel to condominium sales in urban centres and to all home types in retirement-oriented communities.”
The BC housing market ended the year with a strong December. Home sales increased 4 per cent from November, on a seasonally adjusted basis. However, the year-end results were likely pushed higher by some homebuyers advancing their purchases to avoid tougher mortgage qualification rules in the new year.
In December, a total of 5,738 residential unit sales were recorded by the MLS® across the province, an increase of 21.5 per cent from the same period last year. Total sales dollar volume was $4.2 billion, up 36.3 per cent from December 2016. The average MLS® residential price in the province was $734,108, up 12.1 per cent from the same month last year.
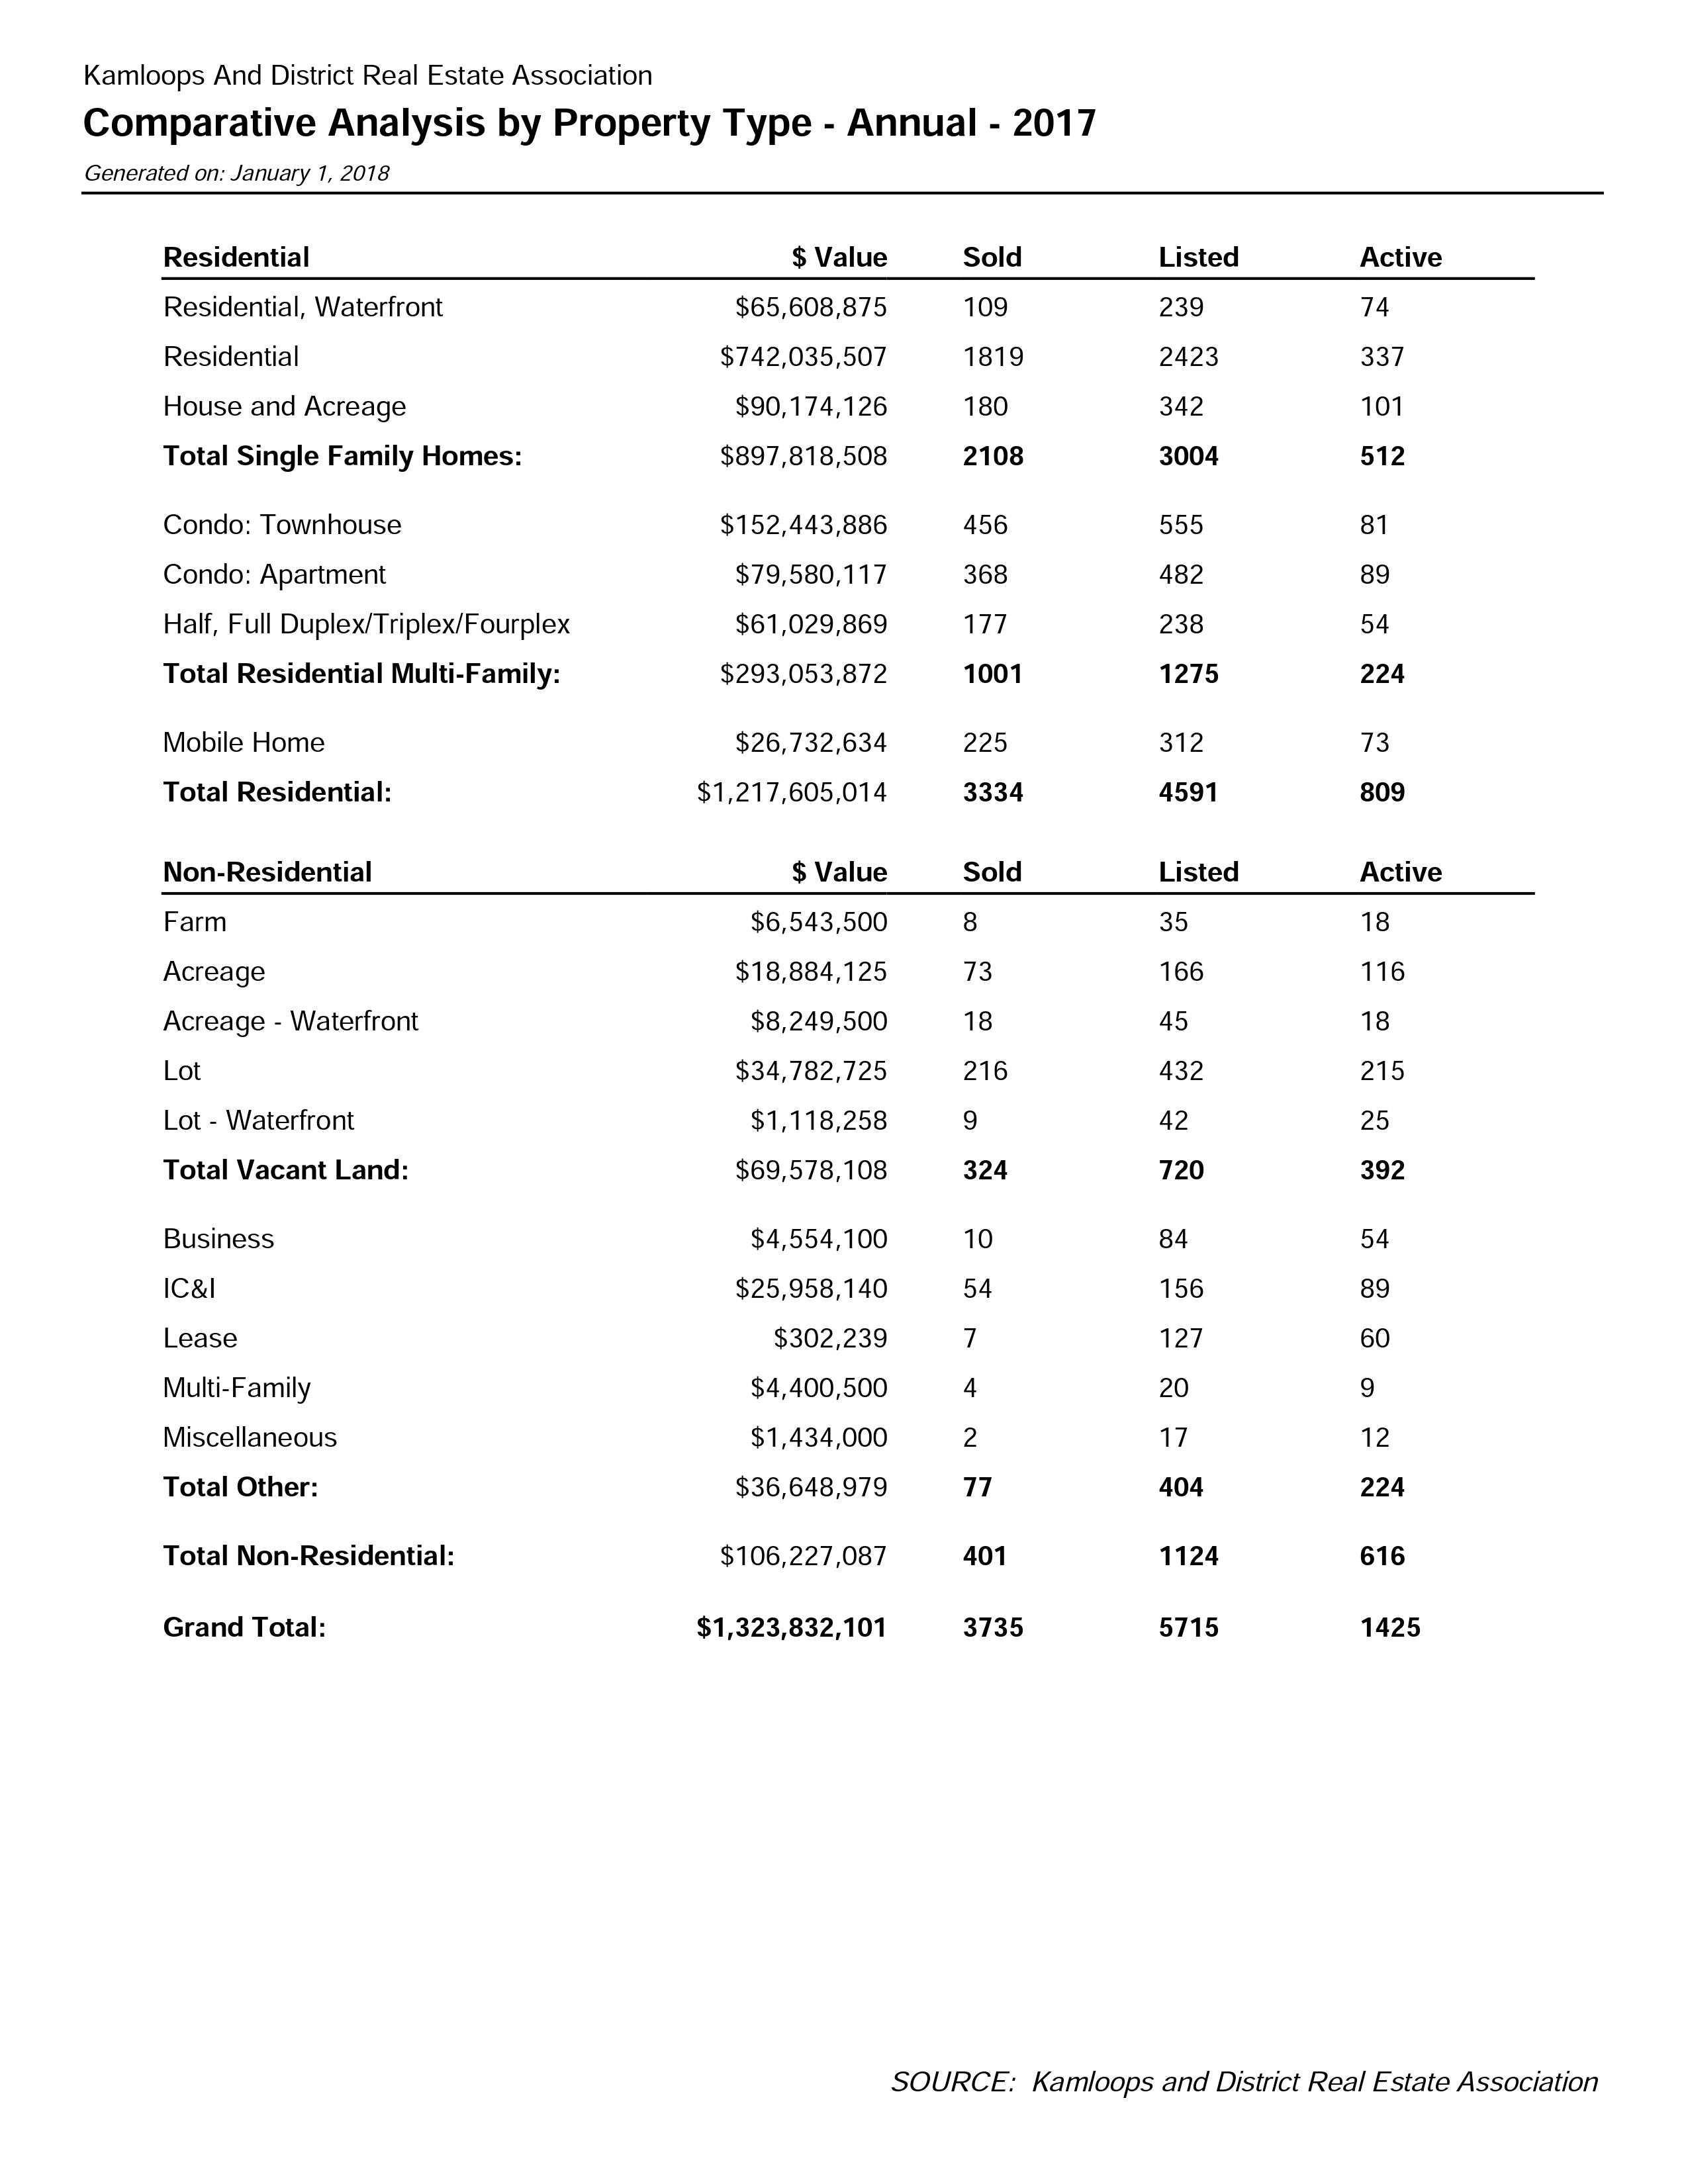
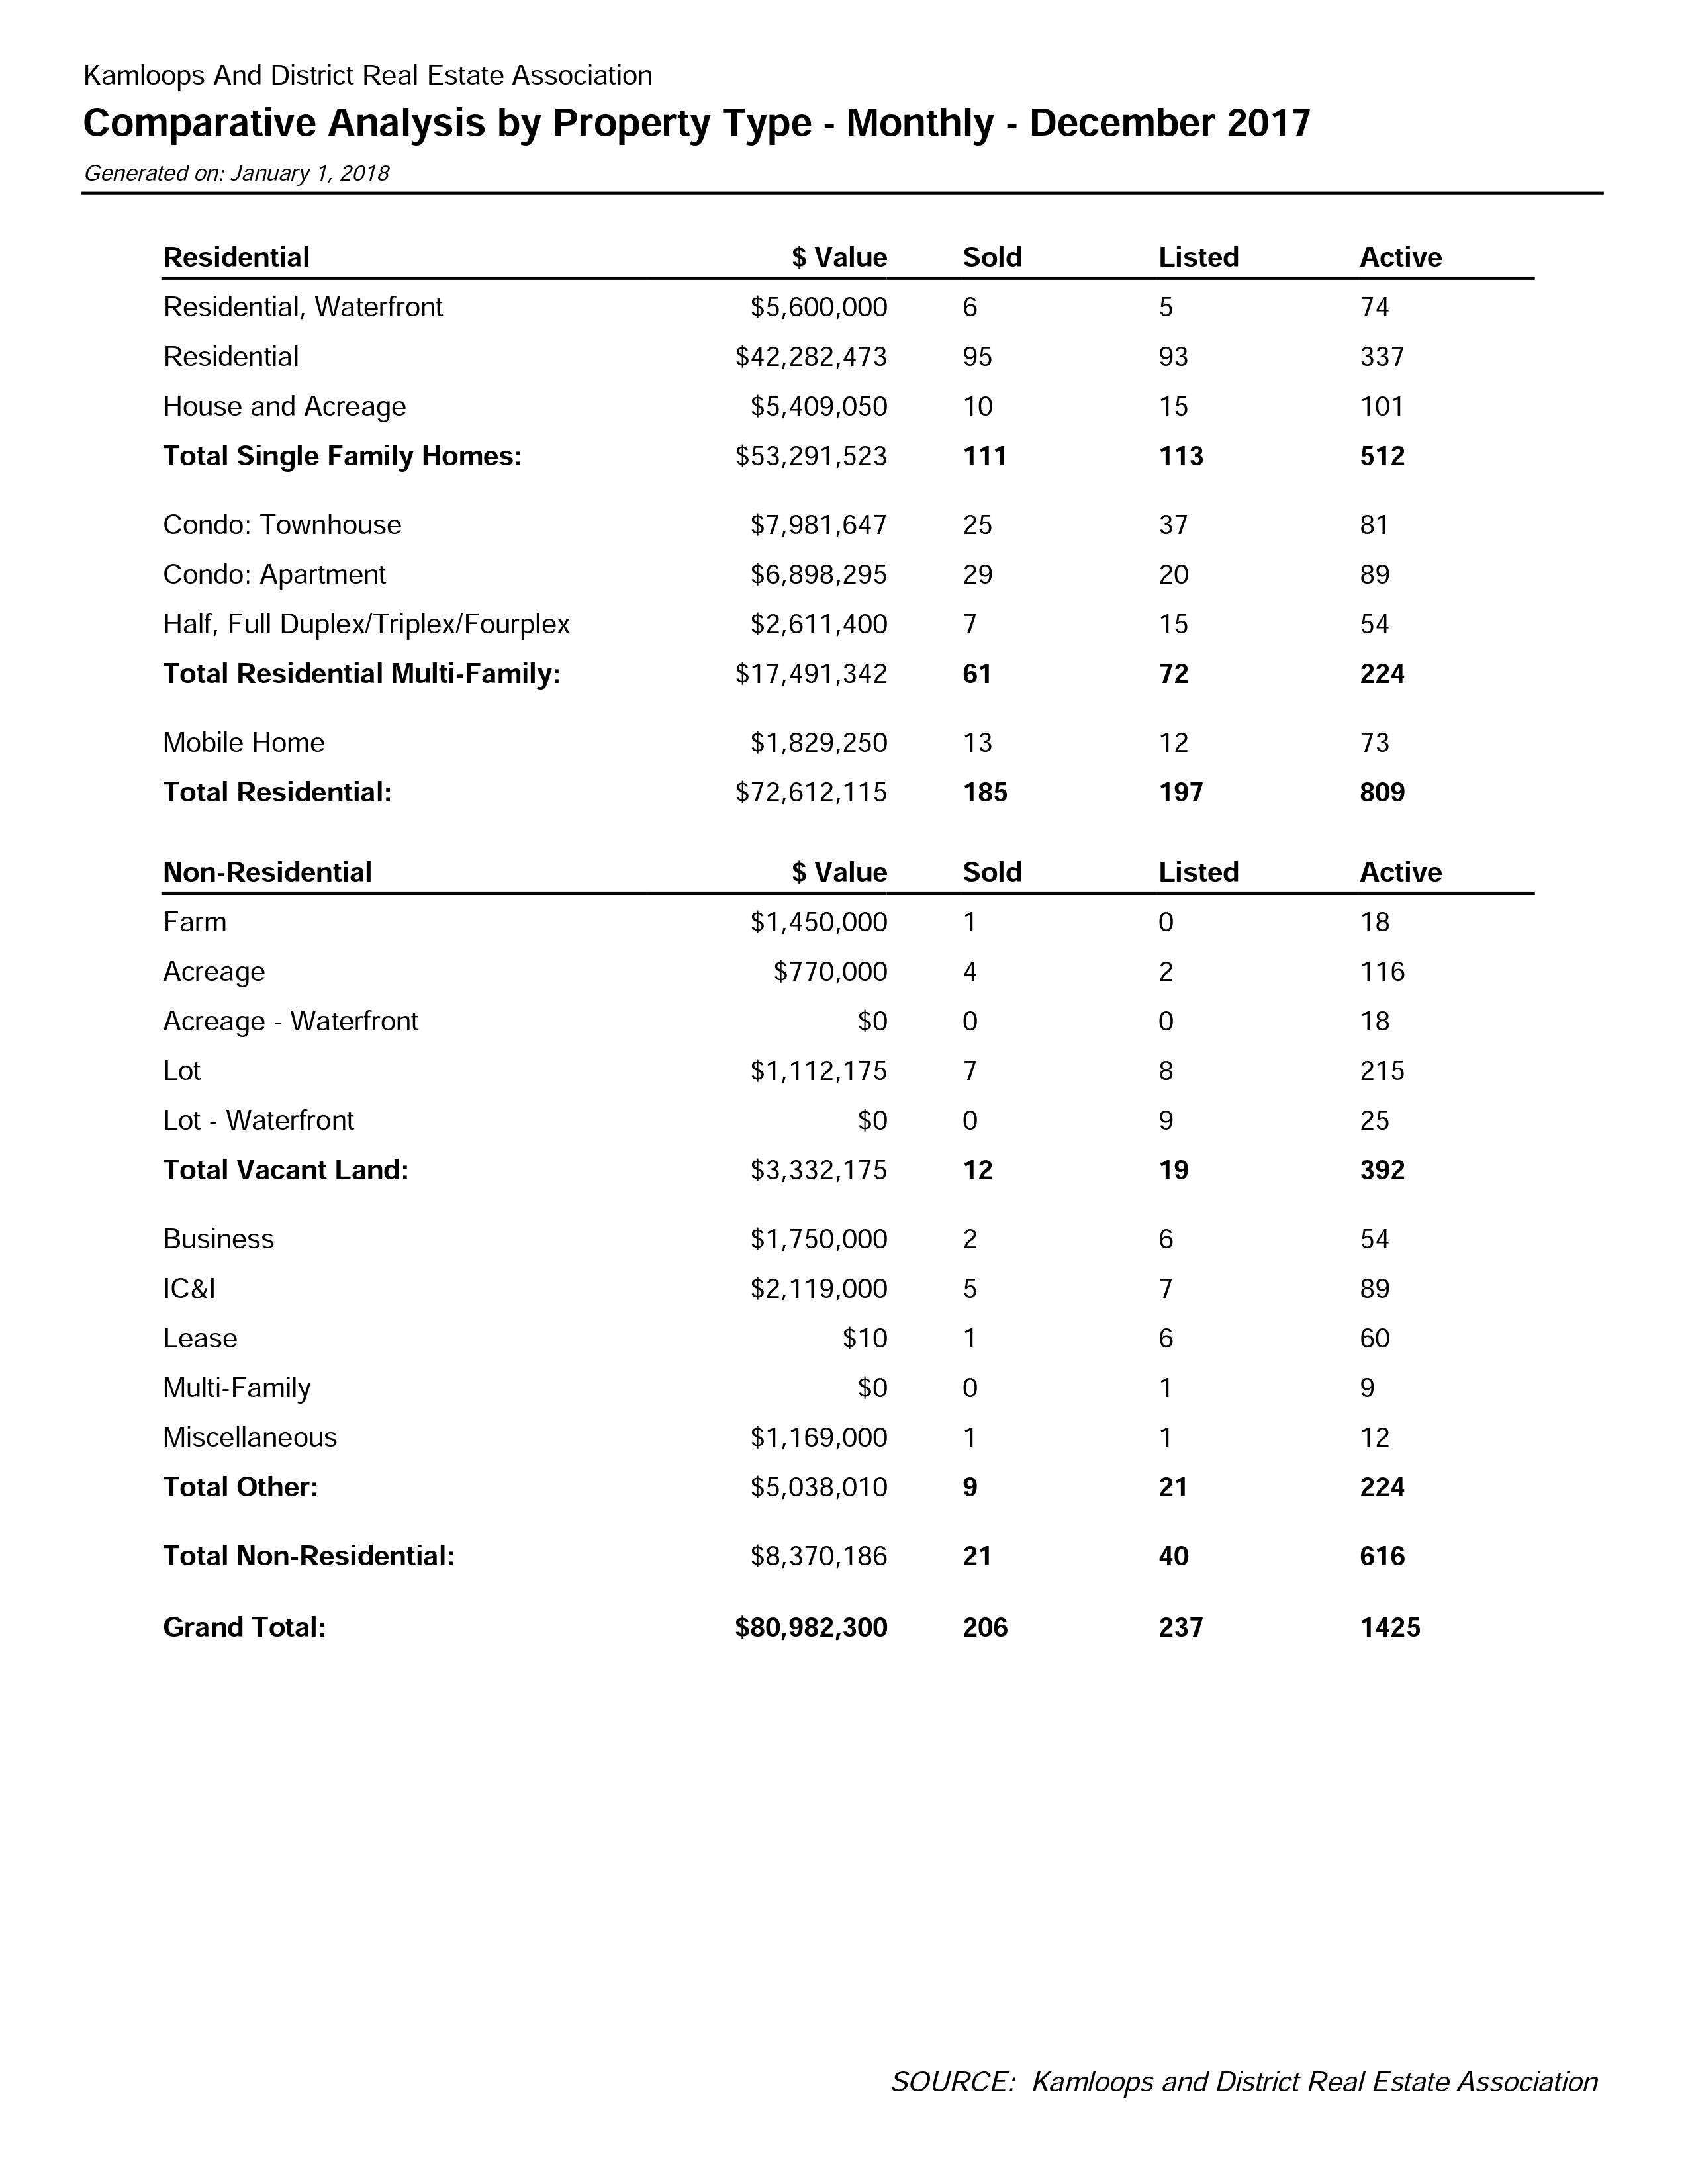
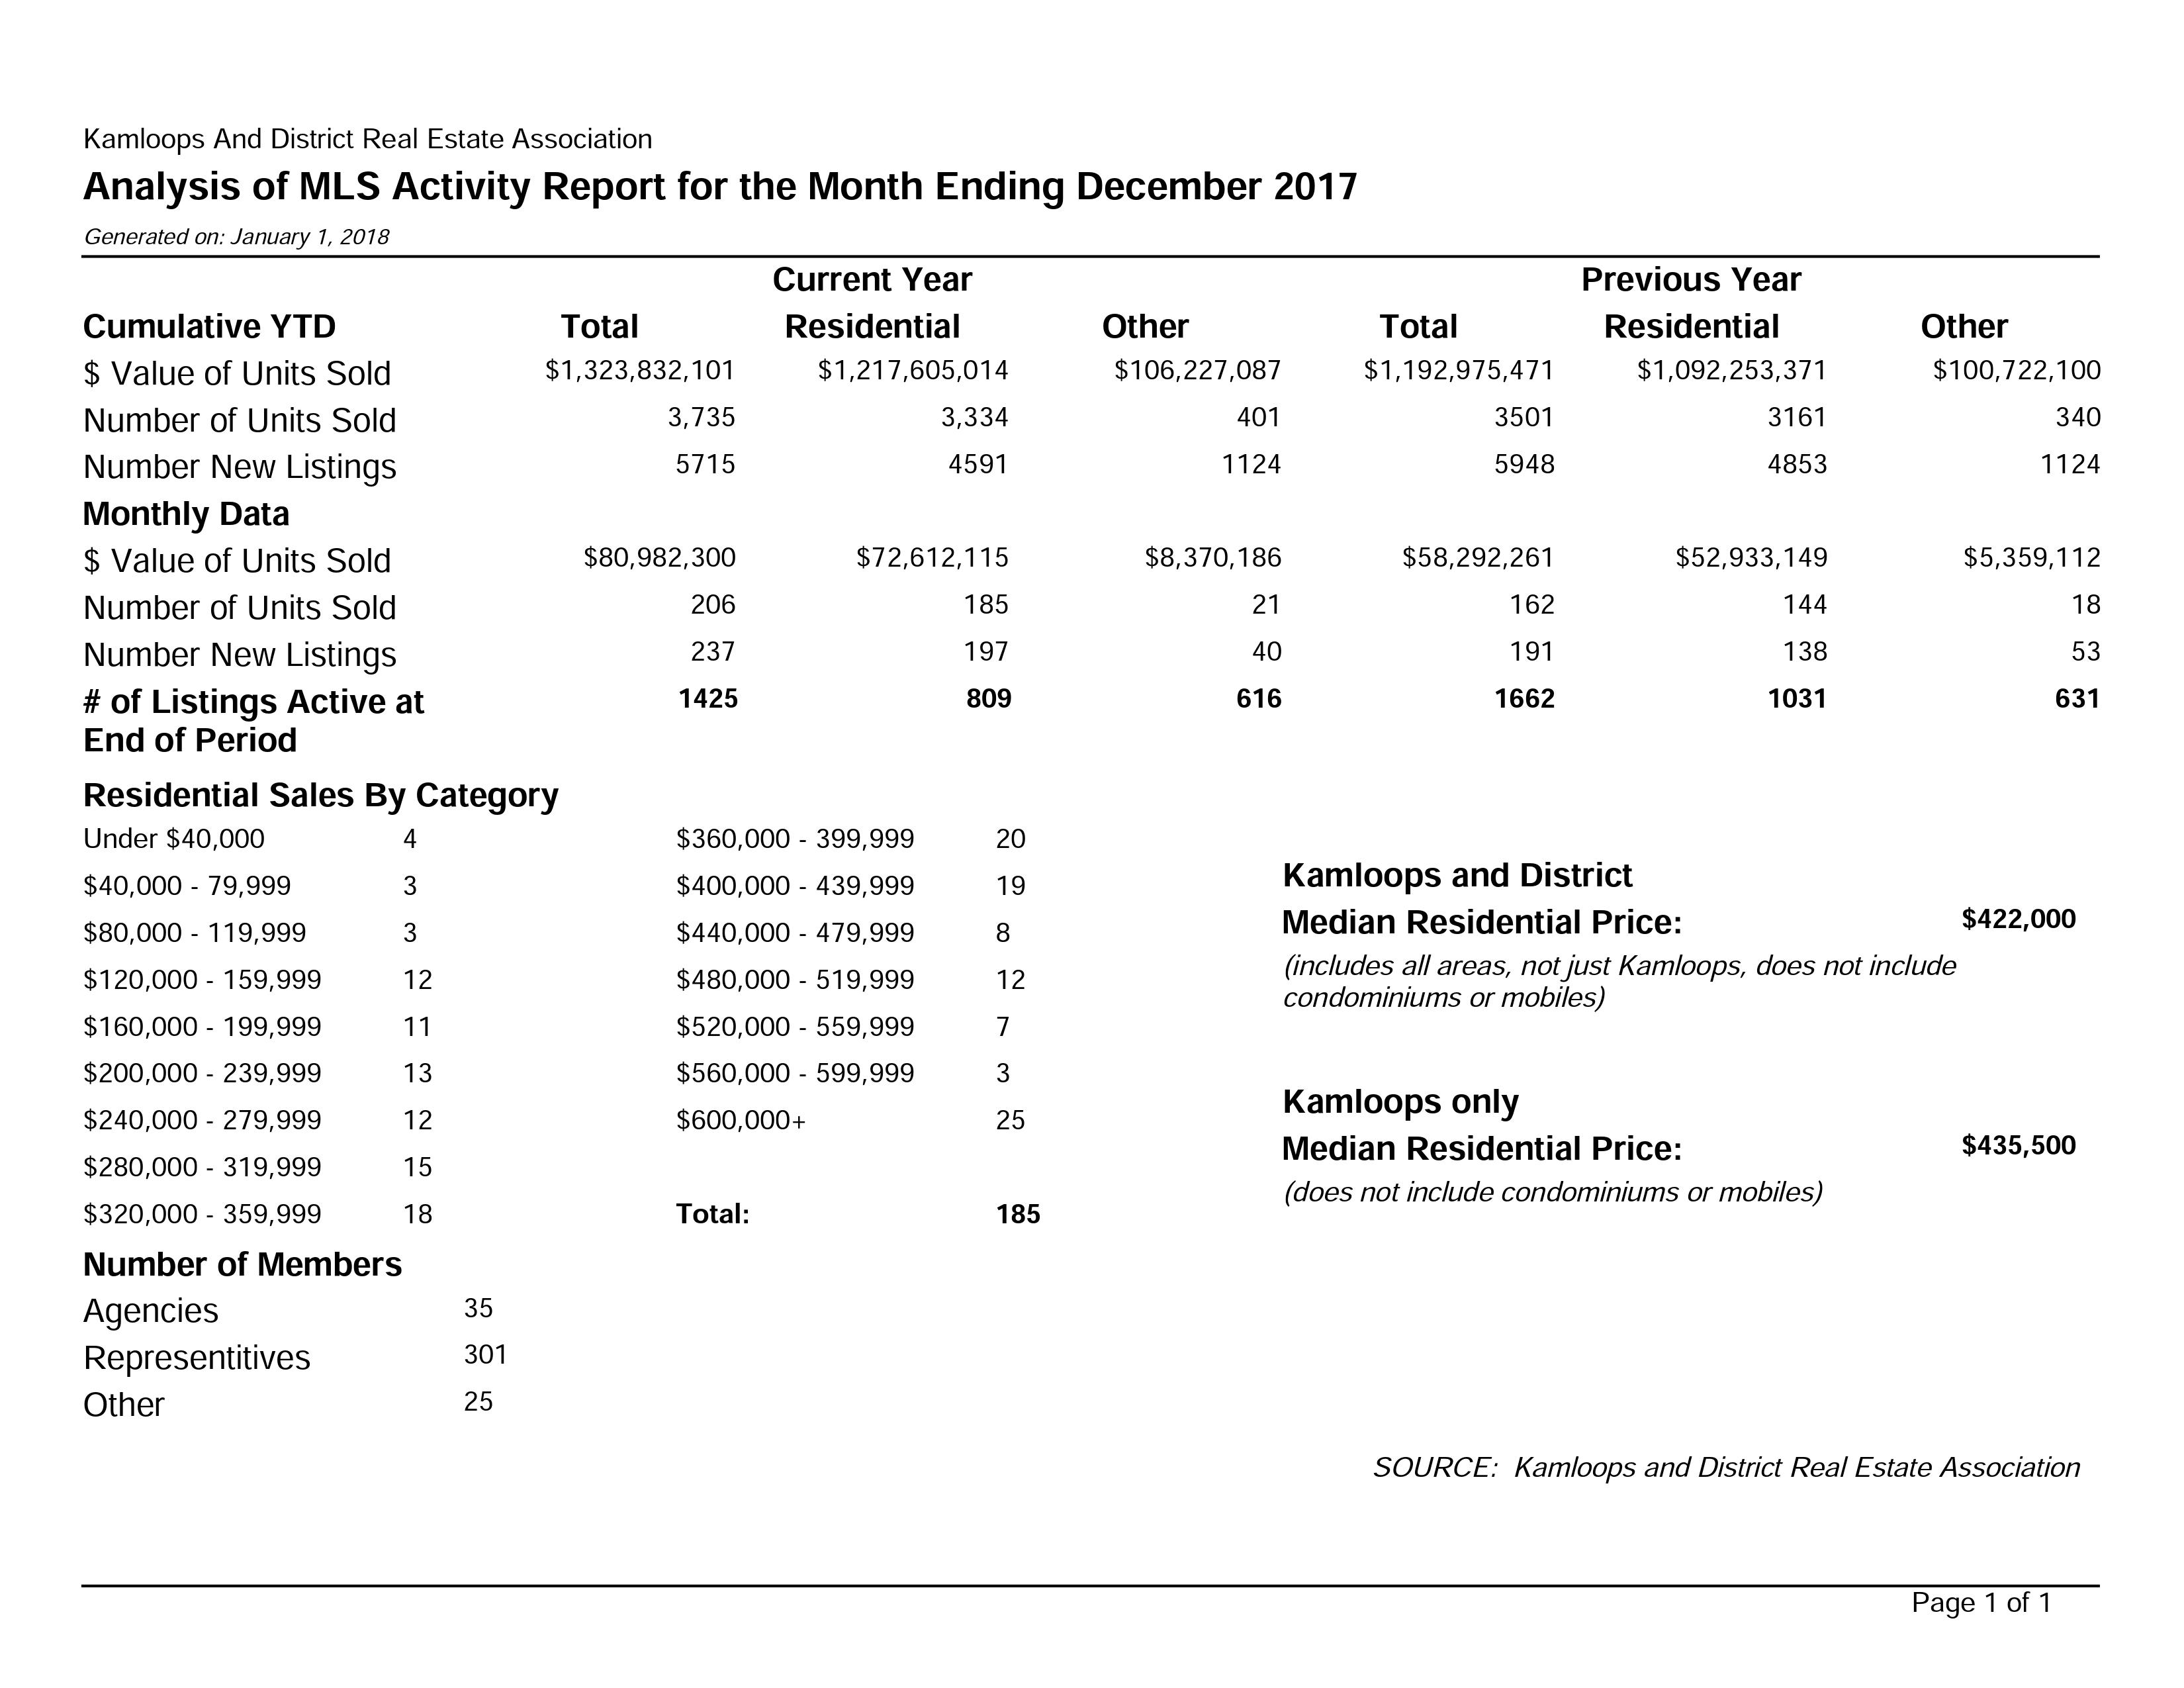
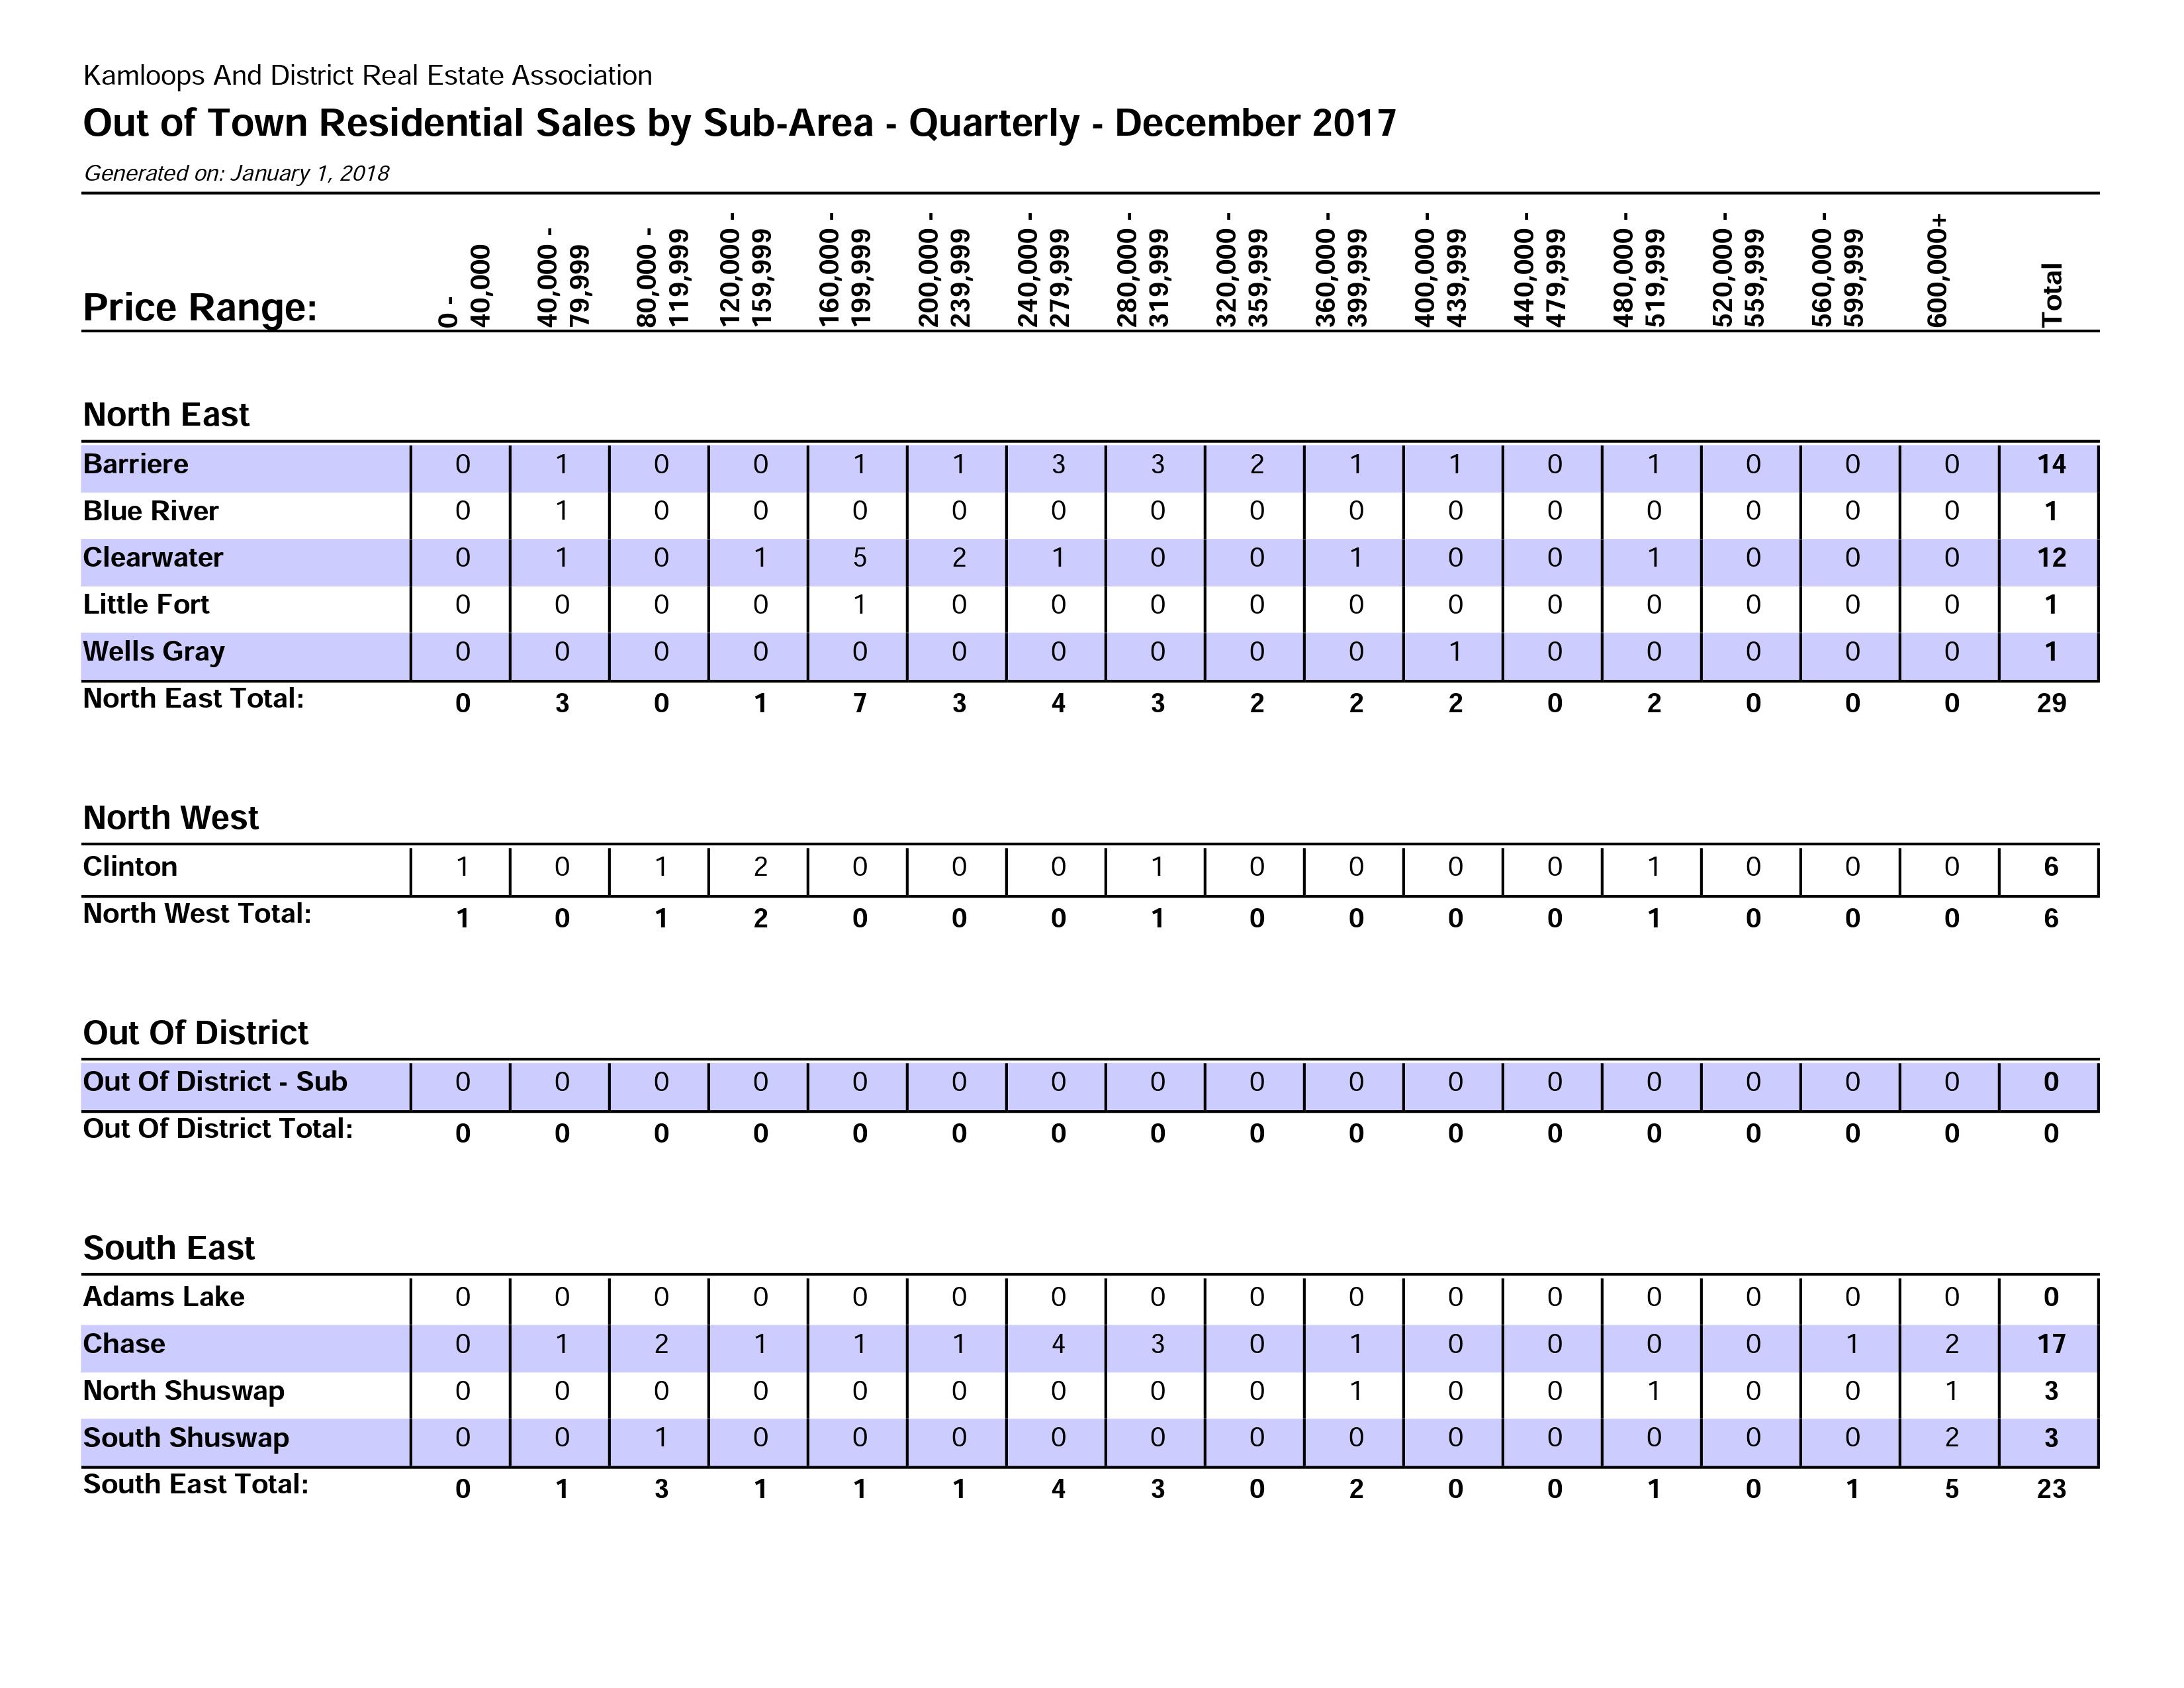
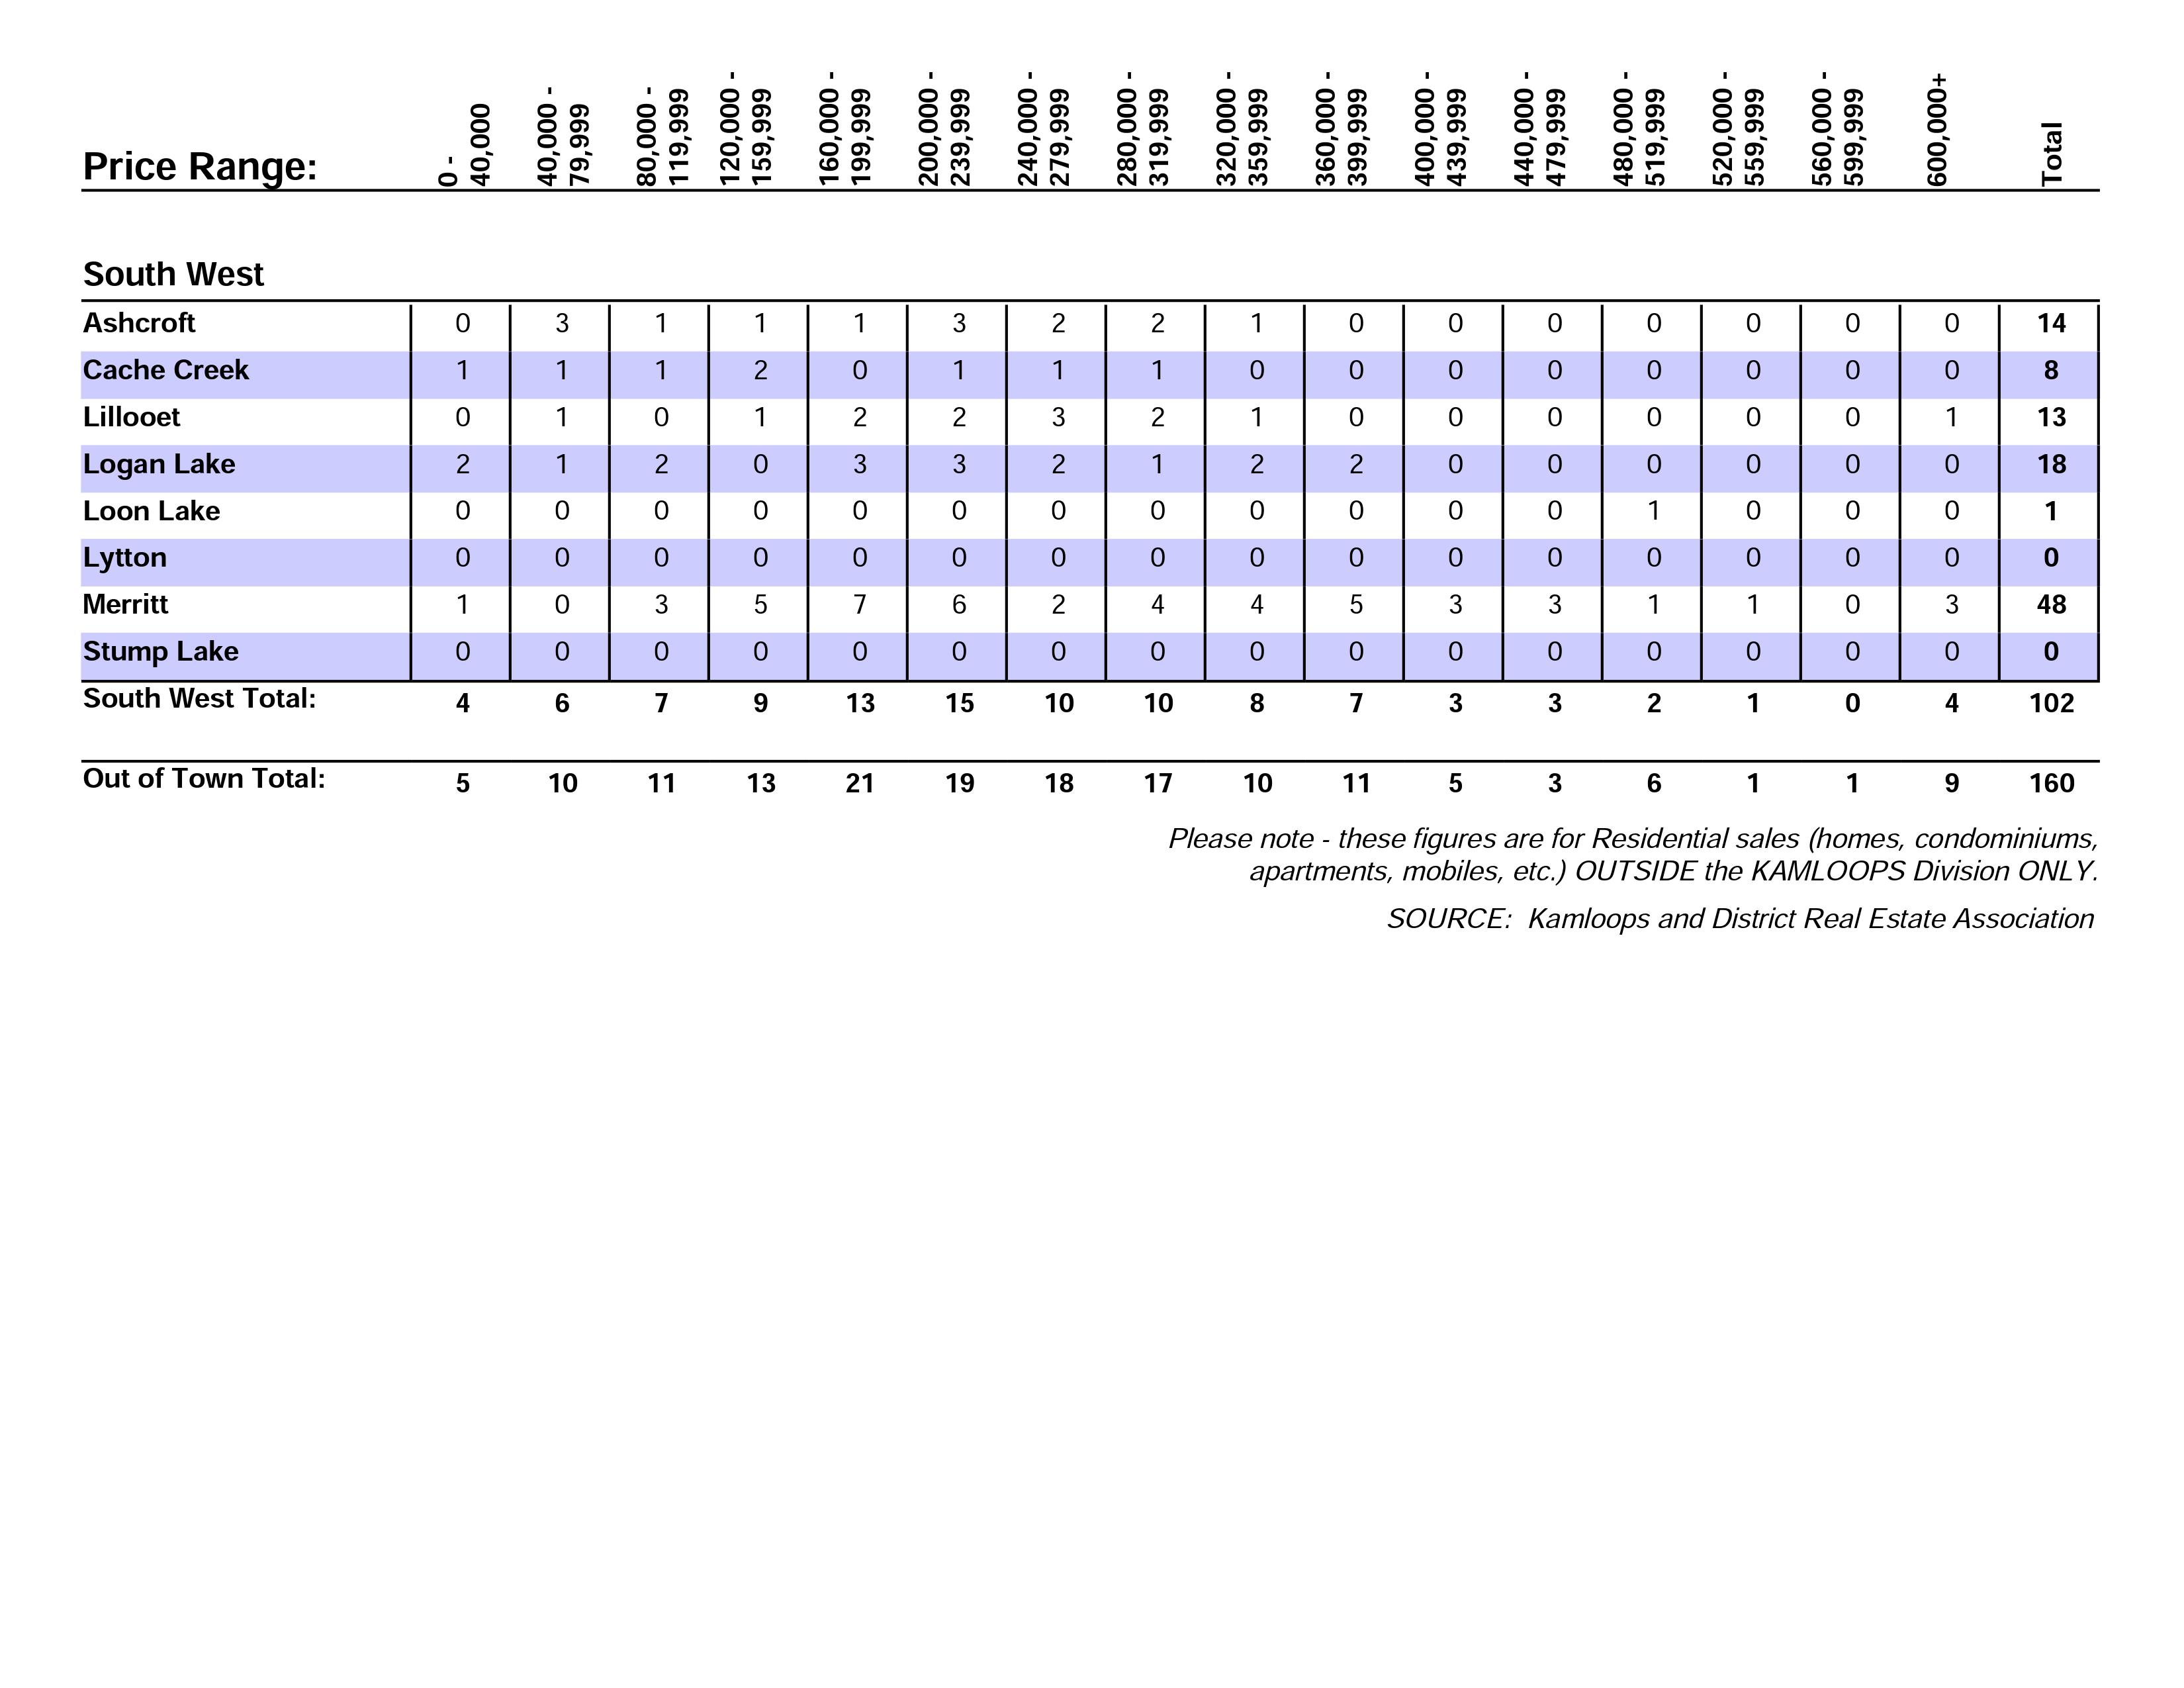
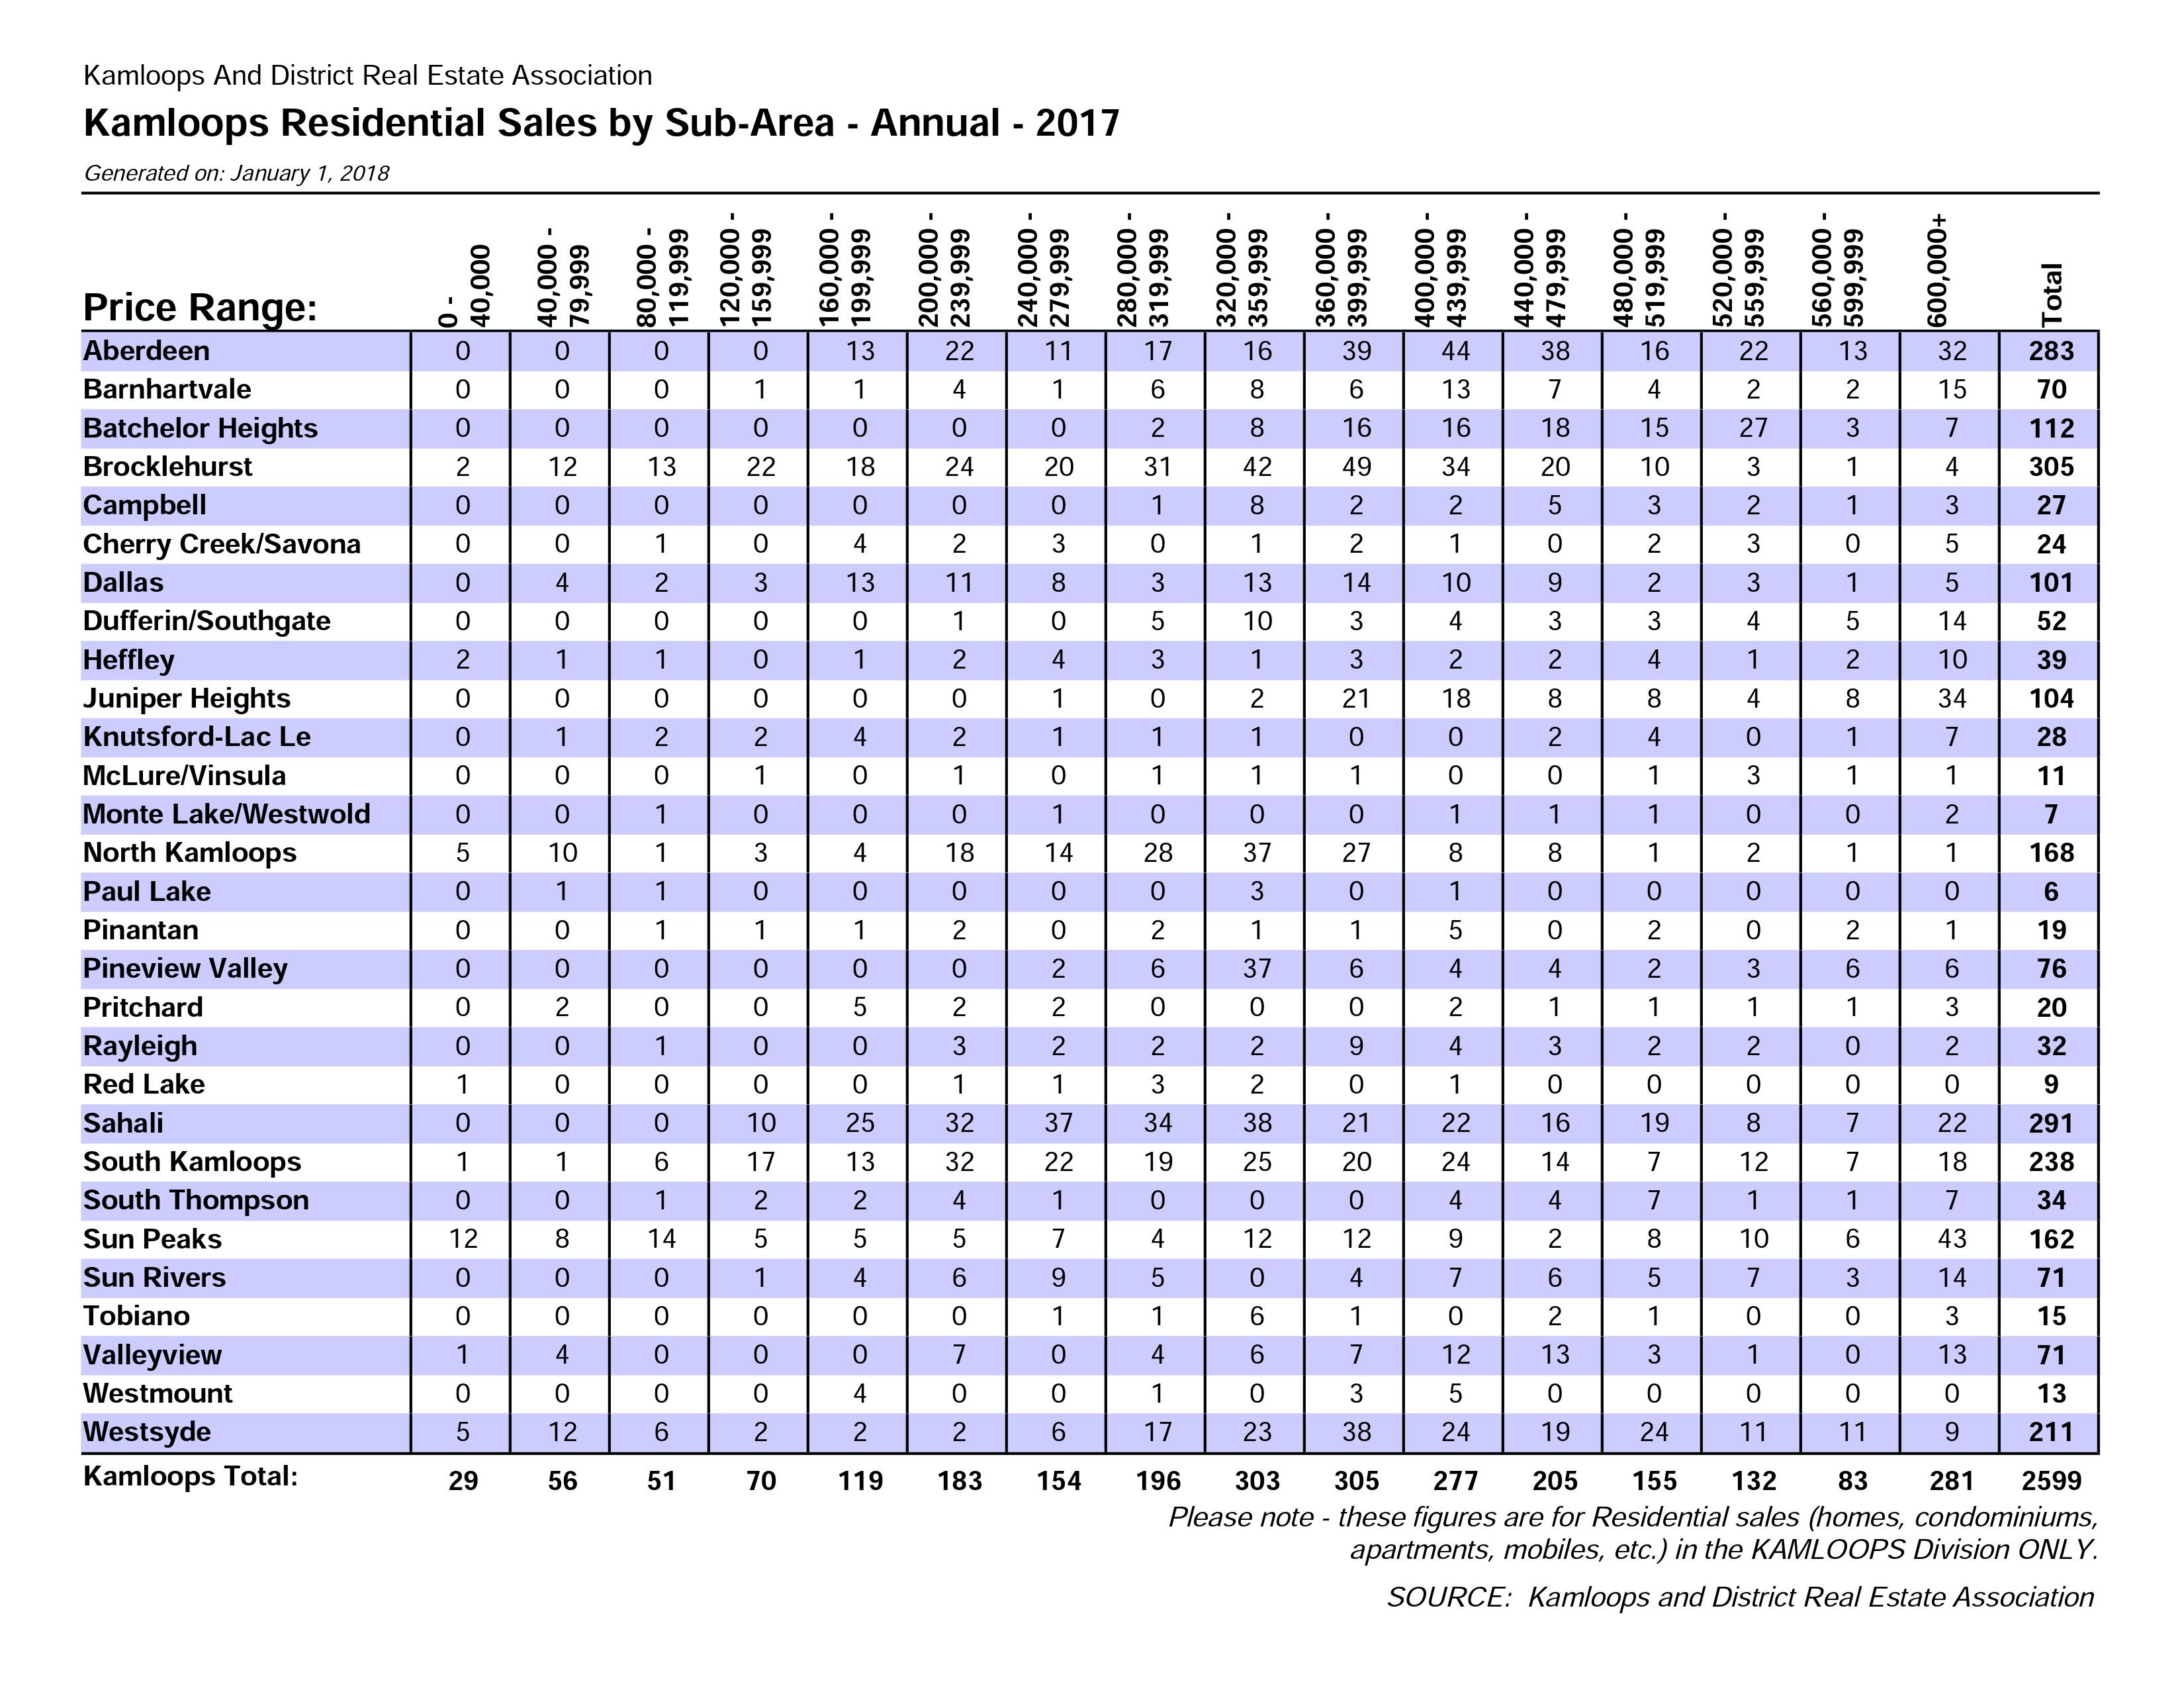
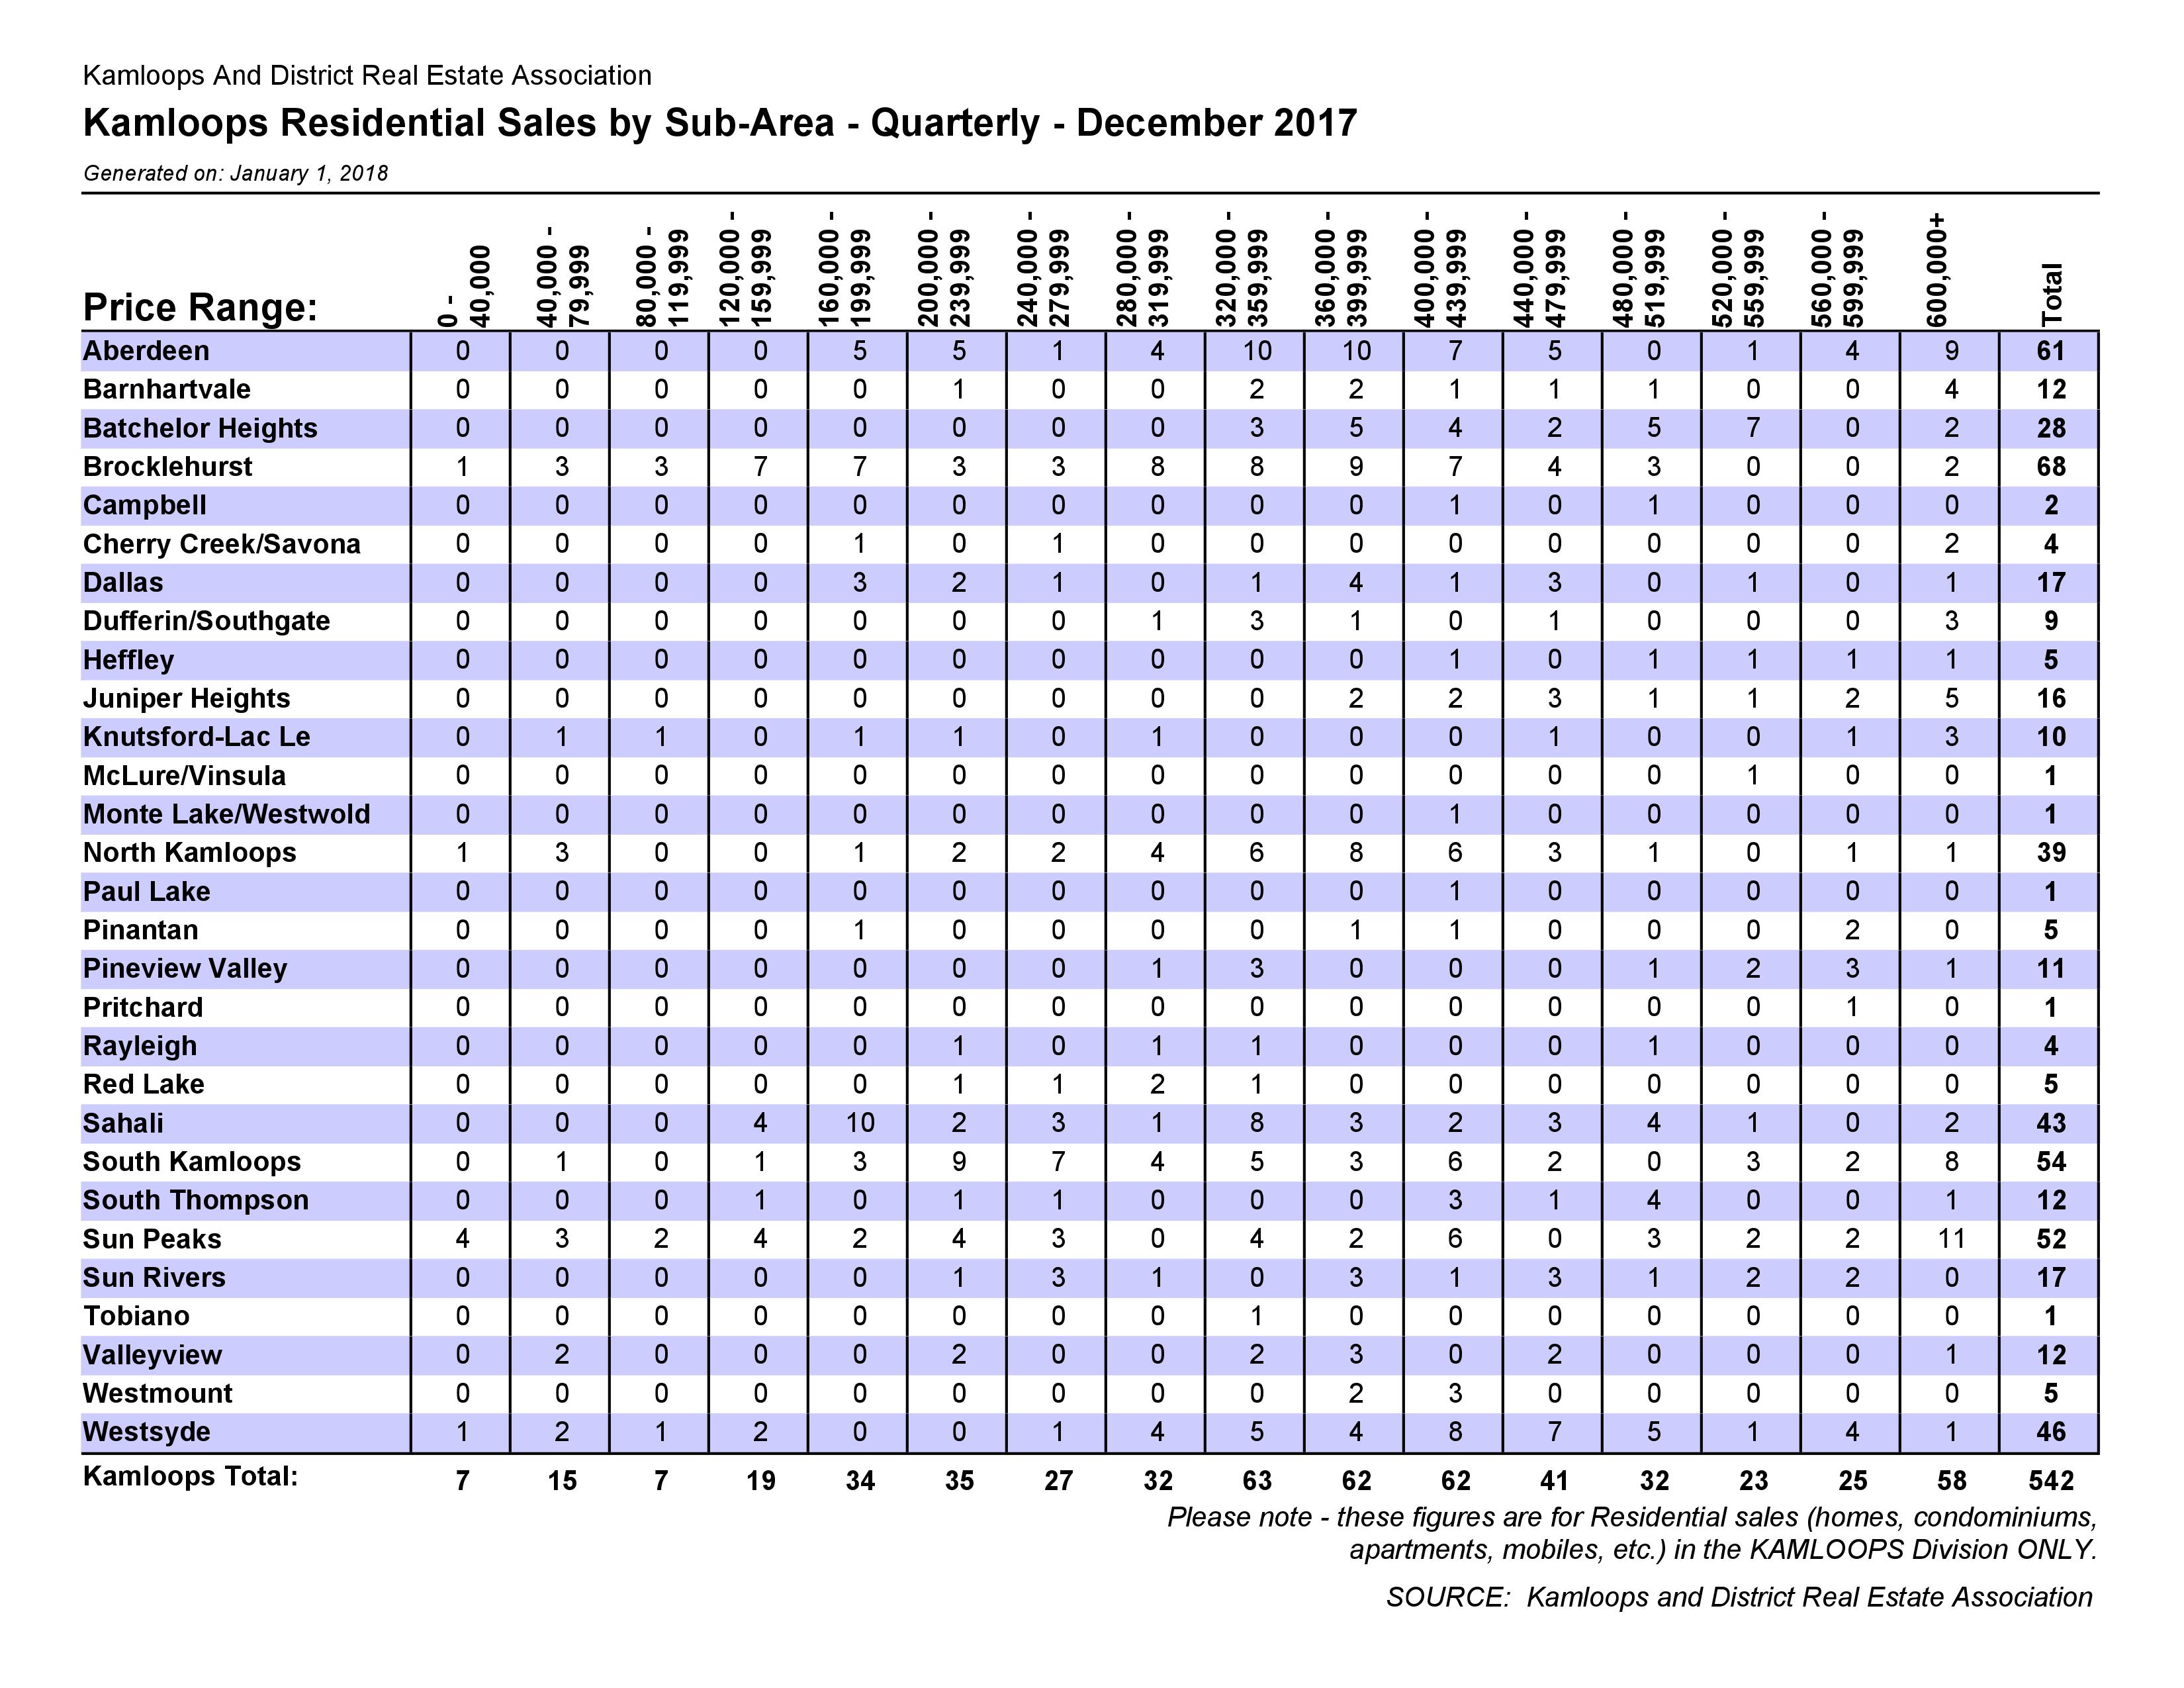
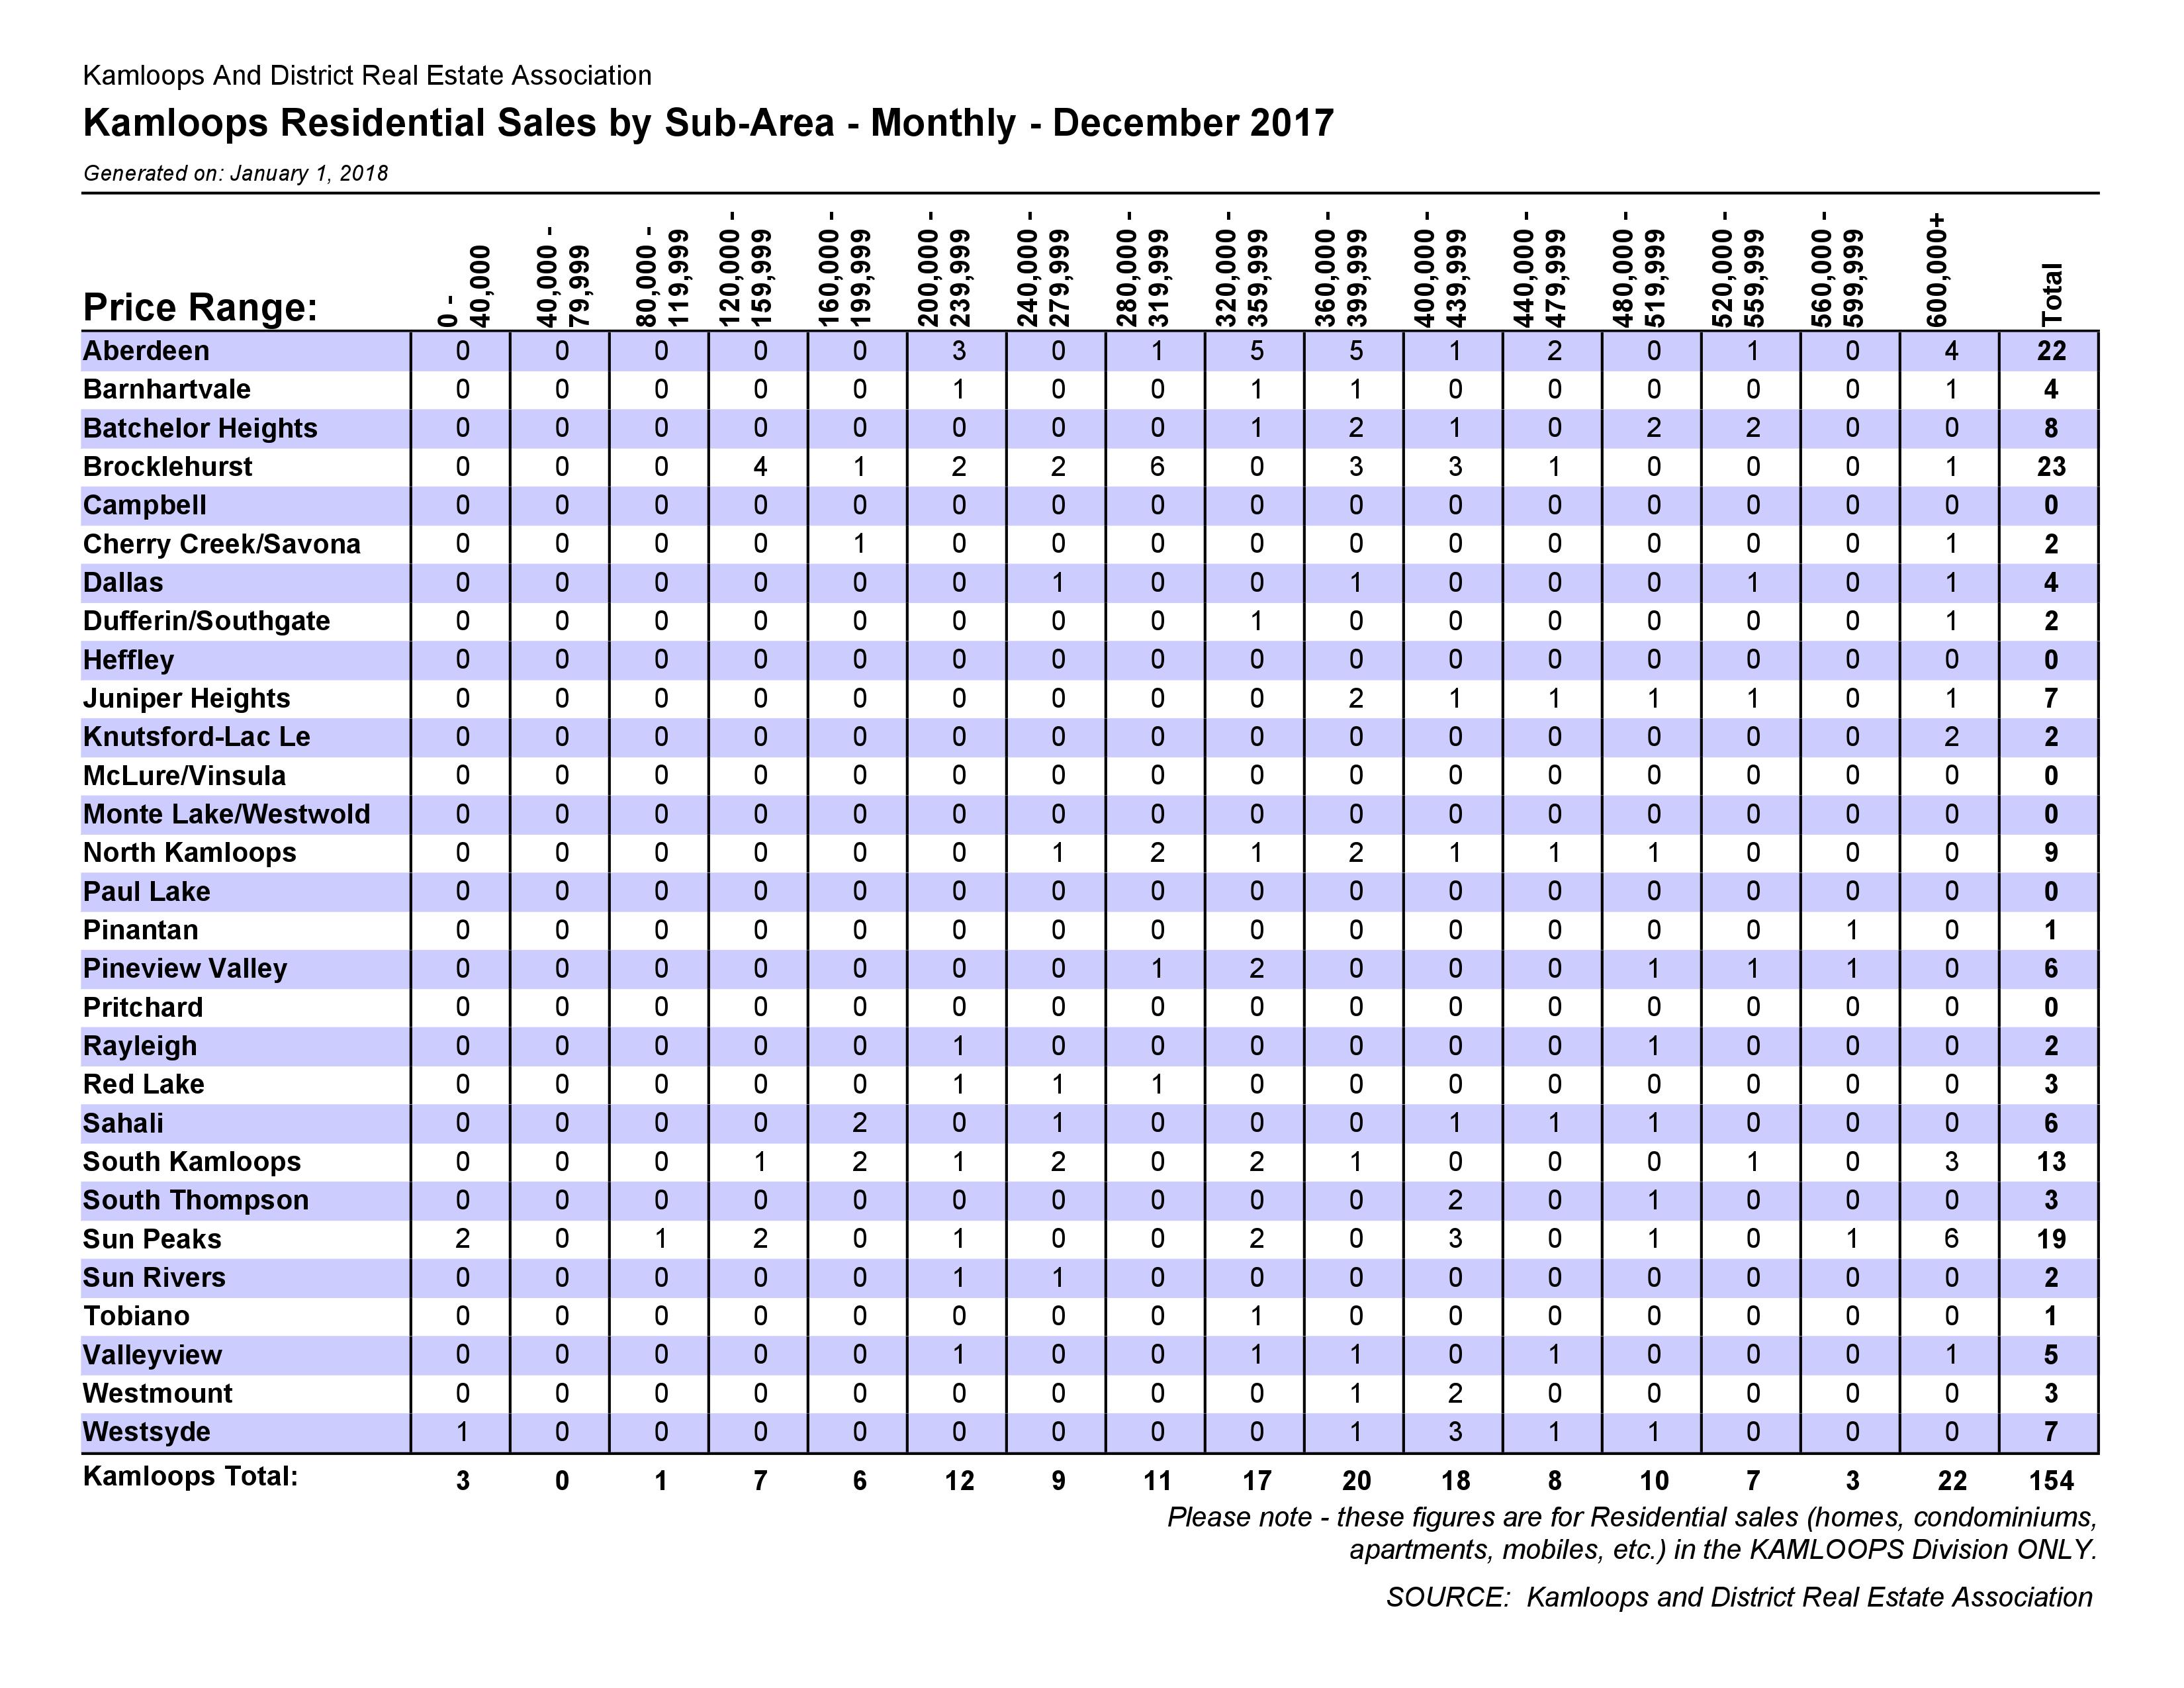
The Kamloops District Real Estate Association has released the latest Statistics For December 2017, 4th Quarter and 2017 Year End. Click on the image below to enlarge or PDF documents included in the links below.
Comparative Analysis by Property Type Dec 2017 – Annual
• Rising rates and tighter mortgage regulations in 2018
• Canadian economy slowing
• Bank of Canada waiting on higher inflation
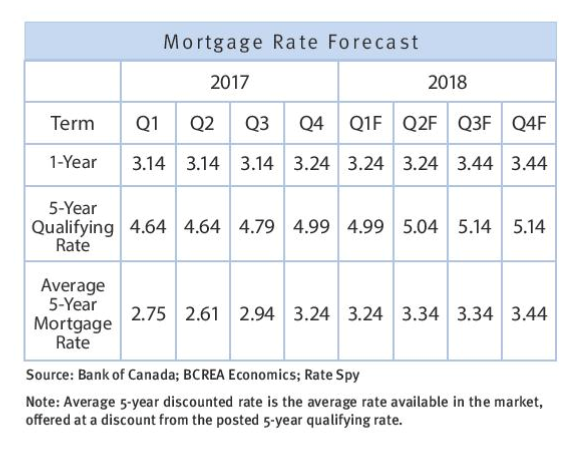
Mortgage Rate Outlook
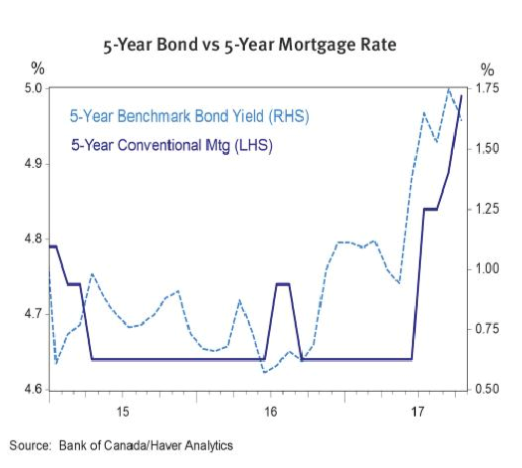
Canadian mortgage rates rose substantially in 2017 and are forecast to rise further in 2018. After beginning the year at or near historical lows for both the qualifying rate as well as 5-year contract rates, an acceleration of economic growth prompted a shift at the Bank of Canada and a withdrawal of stimulus implemented to help the economy absorb the oil-shock of 2015.
After the hawkish turn by the Bank of Canada, the Canadian 5-year bond yield, the key benchmark for the mortgage qualifying rate, seemed set on a higher trajectory before a slowing economy and the tepid inflation resulted in markets reassessing the likelihood of further rate hikes. The 5-year mortgage qualifying rate now sits at a three-year high of 4.99 per cent, while most lenders offer a discounted rate of 3.24 per cent. Our baseline forecast for
2018 is for those rates to increase to 5.15 per cent and 3.44 per cent, respectively.
One complicating factor will be the impact of new mortgage regulations, which require borrowers with more than 20 per cent equity to qualify at a rate at least as high as the 5-year posted mortgage rate. This will erode purchasing power by as much as 20 per cent, and will likely cause some prospective buyers to delay home purchases. Since non-federally regulated lenders such as credit unions do not need to comply with those regulations, large bank lenders could hold off on raising mortgage qualifying rates to remain competitive.
Economic Outlook
In the four quarters from the second half of 2016 to the first half of 2017, the Canadian economy grew at an average quarterly rate of 3.6 per cent, posting more than 4 per cent
growth in the second quarter of 2017. However, in the third quarter, growth slowed to just 1.7 per cent.
Despite a second-half slowdown, the Canadian economy still saw a surge in employment in October and November and will post annual real GDP growth of over 3 per cent in 2017, making it the envy of most advanced economies around the world.
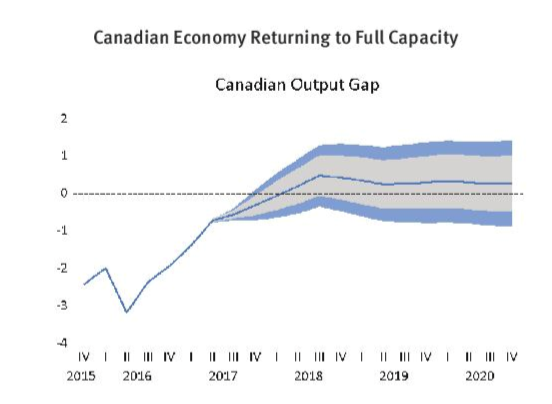
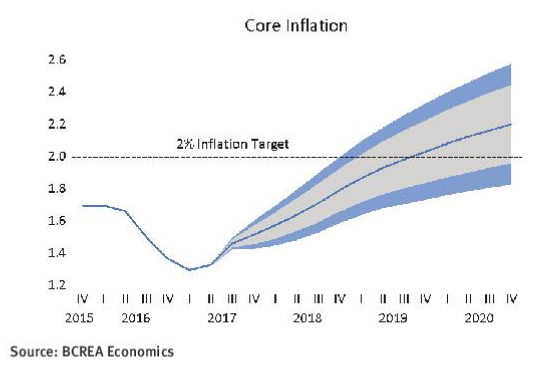
We do not expect that performance to be repeated in 2018, as the effect of higher interest rates and trade disputes present a drag on growth. Those factors are forecast to slow the overall Canadian economy to a still above-trend 2.2 per cent growth next year. As relatively strong growth continues to erode slack in the economy, inflation should return to its 2 per cent target by the end of next year.
Interest Rate Outlook
Despite strong economic growth, Canadian inflation remains subdued. The argument for a more hawkish approach from the Bank of Canada relies on two factors.
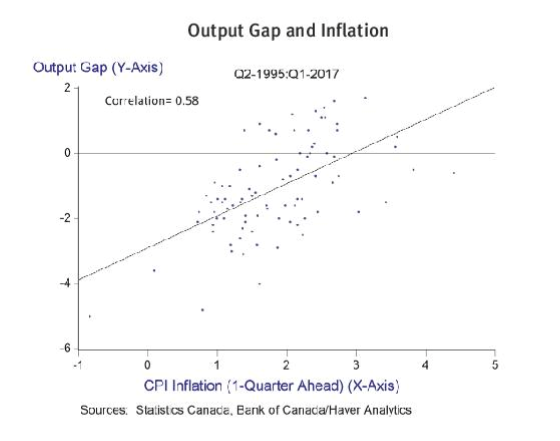
Firstly, that the elimination of unused capacity in the economy, generally referred to as the output gap, is inflationary. Therefore, an economy operating at or above capacity, as the Canadian economy is projected to do, should see rising price pressure. That view is supported by statistical evidence, though inflation has been well anchored due to the success of inflation targeting.
Secondly, the Bank’s framework for monetary policy is built upon setting interest rates at a “neutral” level to stabilize consumer price inflation around the Bank’s 2 per cent target. Since the Bank’s policy rate is currently 200 basis points below its estimate of “neutral,” there is an upward tilt to the Bank’s bias. That is, all else equal, the Bank would prefer to see interest rates “normalize” to a higher level over the medium term.
Still, there are significant risks to the downside for the Canadian economy over the next year. Elevated household debt presents a challenging tight-rope for monetary policy, as rates rising too quickly could have substantial and widespread consequences. Moreover, forthcoming restrictions on mortgage qualifying will already have a dampening impact on housing demand, which should also factor into the Bank’s thinking on monetary policy.
Weighing those risks against expectations of a closing output gap and inflation slowly moving toward 2 per cent over the next year, the Bank may still find just enough
reason to raise the its target rate once or twice in 2018.

 Canadian mortgage rates rose substantially in 2017 and are forecast to rise further in 2018. After beginning the year at or near historical lows for both the qualifying rate as well as 5-year contract rates, an acceleration of economic growth prompted a shift at the Bank of Canada and a withdrawal of stimulus implemented to help the economy absorb the oil-shock of 2015.