Canada Mortgage and Housing Corporation (CMHC) Sees Home Starts Stabilizing in 2011 and 2012

This article appeared on The Daily Commercial News and Construction Record on February 21st, 2011.

Canada’s national housing agency says the pace of new-home construction will stabilize in 2011 and 2012 after trending lower at the end of last year.

Canada Mortgage and Housing Corp. predicts between 157,000 and 192,000 new housing units will be built this year, with the number remaining virtually the same in 2012. In its first quarter housing market outlook, released Feb. 17 it said economic growth and lower unemployment will prop up the need for new homes.

“This, in conjunction with relatively low mortgage rates, will continue to support demand for new homes. Housing starts will remain in line with long-term demographic fundamentals over the course of 2011 and 2012,’’ Bob Dugan, chief economist for CMHC said.

Dugan said listing prices are expected to keep pace with increases in inflation.

The corporation said sales of existing homes should be in the range of 398,000 and 485,000 this year.

In its January figures, CMHC said Canada was on track to build 170,400 units of housing this year, about 10 per cent less than in 2010.

The housing market was unusually active in late 2009 and early 2010 due to a catch-up from the recessionary levels in late 2008 and early 2009 and historically low interest rates that kept the cost of borrowing low.

The real estate market kicked off last year on a tear as buyers rushed into the market in advance of higher interest rates, new mortgage rules and a new harmonized tax regime in two provinces.

Link

Canada’s Housing Market to Be More Stable in the Next Two Years: RBC

CBC News posted this article on Thursday, February 10, 2011. Click here for the full RBC Resale Housing Market Outlook.

Canada’s housing market is likely to be far more stable in the next two years than it has been for the last two, the Royal Bank of Canada said in a report on Thursday.

The housing market since 2008 was shaped by truly exceptional events and factors such as the global financial crisis, a major recession that destroyed nearly 430,000 jobs in Canada, cuts in policy interest rates to the lowest levels in a generation, the introduction of a harmonized sales tax in Ontario and British Columbia, and the tightening of mortgage rules, RBC’s senior economist Robert Hogue said.

“With the economy (both global and national) on a more solid footing now, the road ahead will be less bumpy,” he said.

But there will be regional variances, the bank expects. With Saskatchewan, Alberta and Manitoba seen leading economic growth among the provinces in 2011, demand for housing will similarly outpace that of other provinces. A slowing housing market is possible in areas east of Manitoba.

The bank expects home prices to rise in all provinces, but at a very slow pace in most cases in 2011.

On average, the bank is forecasting price gains of 0.5 per cent in 2011 and 1.3 per cent in 2012. That compares with a very strong, but unevenly distributed, 8.3 per cent gain in 2010.

“In our opinion, the Canadian housing market is on path towards mostly flat levels of resale activity and minimal price increases this year and next,” Hogue wrote.

Earlier this week, the Canadian Real Estate Association forecast the national average price is now expected to rise by 1.3 per cent in 2011 to $343,300.

Link

Canadian Banks Unlikely to Jeopardize Economy by Raising Interest Rates in 2011

This article appeared on The Record on February 9, 2011 and was written by Chuck Howitt.

While mortgage and interest rates are inching higher, the major banks aren’t likely to keep pushing them up if they sense household debt is too high, an economist told local real estate agents Wednesday.

Two large banks announced mortgage rate increases this week, but the banks will likely refrain from further increases if they jeopardize the economic recovery, said Paul Ferley, assistant chief economist for RBC.

The Bank of Canada became alarmed when debt-to-income ratios, fuelled by a long period of low mortgage rates, continued to rise in Canada during the recession while dropping in the U.S., Ferley said.

Traditionally those ratios have been lower in Canada, but now they are about equal in both countries, he told about 150 agents at Coldwell Banker Peter Benninger Realty.

While mortgage debt continues to be worrisome, Ferley doubted Canada is on the verge of a housing-price correction. In the late 1980s, when the last housing bubble burst, mortgage payments were growing much more quickly than incomes, he said.

The same trend has not been occurring in recent years, Ferley said.

Housing prices jumped about 20 per cent coming off the recession, but they have since begun to follow the historical pattern of more gradual increases. He expects that flattening trend to continue.

Looking at the North American economy as a whole, economists no longer fear a double-dip recession, Ferley said. The economic recovery “will be gradual, but sustained,” he said.

While a sudden eruption in the Egyptian crisis could send oil prices soaring and destabilize the world economy, the U.S. economy is gaining steam, he said. But the private sector needs to pick up the slack now that government stimulus is being turned off, he added.

The Canadian economy, while still closely tethered to the U.S. economy, is well positioned because commodity prices, particularly oil prices, remain at historically high levels, he said. He expects oil to remain at the robust price of around $90 a barrel because of demand from countries such as China and India.

High commodity prices are not necessarily good news for Ontario’s economy, which relies more on manufacturing and a healthy U.S. economy, Ferley said.

On the positive side, auto sales have climbed past 12 million units a year in the U.S. after dropping to about nine million during the recession and manufacturing has picked up, though just modestly, he noted.

In Waterloo Region, manufacturing accounts for 22 per cent of the labour force, higher than the provincial average of 14 per cent, he noted.

This is a concern, but strong building-permit activity particularly in the commercial and institutional sectors and the rebound in housing starts and employment have brightened the outlook for the local economy, he said.

Link

TD Economics Special Report on Financial Vulnerability of Canadian Households: BC Most Vulnerable

TD Economics released a special report on February 9th, 2011. This report assesses the financial vulnerability of households across Canada. Below, I have included British Columbia specific information from the report. Click on the images below to enlarge.

The main highlights of the report are:

  • The focus nationally on household debt has raised questions about which regions of the country face the most significant challenge.
  • TD Economics has constructed an index of financial vulnerability, which takes into account six key metrics of household financial position.

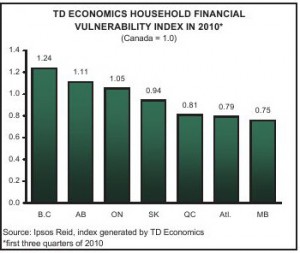
    TD Economics Household Financial Vulnerability Index

    Household Financial Vulnerability Index

  • The index is not a predictor but is aimed at capturing which regions are more vulnerable in the event of an unexpected adverse economic shock, such as a housing market downturn, a rise in the unemployment rate, or a spike in interest rates.
  • We find that households in British Columbia, Alberta, Ontario and Saskatchewan are the most vulnerable, followed by the Quebec and the Atlantic Region. Meanwhile, Manitoba is the least vulnerable.
  • Despite growing vulnerability across regions, we do not think that a household debt crisis is in the making in any region.

Based on our analysis, we find that households in British Columbia, Alberta, Ontario and Saskatchewan are the most vulnerable. Following next are the Atlantic region and Quebec, while Manitoba is the least vulnerable. That being said, risks related to household finances have been rising broadly across all regions over the past few years, as households have responded to extremely favourable borrowing conditions. With higher interest rates on the horizon set to boost the cost of servicing debt, this upward trend in vulnerability is almost certain to continue over the next 1-2 years.

All regions increasingly vulnerable

Some of the common trends:

  • Vulnerability has been increasing from coast to coast over the past two years– prior to 2009, trends in the vulnerability index were mixed across the country, with some regions experiencing sharp increases while others registered declines. However, over the past two years, vulnerability has headed higher right across the board, and for the majority of regions, increases in the index began to accelerate in 2007.

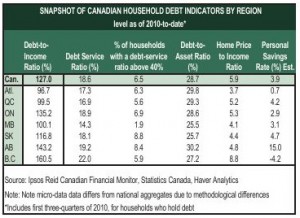
    Snapshot of Canadian Household Debt indicators by region 2011

    Snapshot of Canadian Household Debt Indicators by Region - click to enlarge

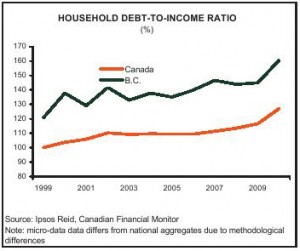
  • Rising household debt-to-income and home price to- income ratios have been the major catalysts driving up vulnerability – the debt-to-income ratio has followed an upward track in all regions since the mid-part of the 2000’s, reflecting in large part the strength of housing markets and the significant easing in mortgage insurance rules in late 2006. These home price increases supported the asset side of the ledger and mitigated the upward trend in the debt-to asset ratios over the past half decade.
  • Debt-service ratios have been falling and remain in a comfortable range – despite rising indebtedness, the falling cost of borrowing has been pulling down the share of income households have been shelling out to service obligations. Low interest rates have also helped to keep a lid on the share of vulnerable households in recent years.
  • All regions will experience a substantial increase in vulnerability over the next few years – our adjusted index shows that even assuming that the debt-to-income ratio holds constant at current levels, which would seem unlikely, vulnerability is set to rise across the board in lockstep with short-term interest rates.

Most vulnerable

Household Debt to income ratio BC vs Canada 2011

Household Debt to Income Ratio: BC vs. Canada

Reflecting the lofty costs of home ownership, households in British Columbia record the highest vulnerability. In particular, B.C. residents on average register the highest debt-to-income ratio, debt-service cost, and greatest sensitivity to rising interest rates. What’s more, B.C. is the only province where the average savings rate is negative.

None of this is new, however, as the province has systematically been the most vulnerable since the start of our data series in 1999. The structural nature of this challenge suggests that there maybe factors at play that are not being captured in the aggregate data. For example, the province’s relatively large economic reliance on its service sector and self-employment – two areas that tend to have higher-than-average incidences of non-reported income – might be superficially driving down income and driving up the various sub-index readings.

In addition, B.C. households appear to have adopted coping mechanisms, such as renting out basement suites, which might not be fully factored into the income side. Even if these factors are part of the story, they don’t address the fact that British Columbia’s index level has recorded the second fastest rate of increase among the provinces over the past half decade.

Higher interest rates over the next few years threaten to leave as many as one in ten households in B.C. in a position of financial stress. On the plus side, rapidly-appreciating home prices in the province has left the debt-to-asset ratio – a metric of household leverage – below the Canadian average. Still, with the home price-to-income ratio pointing to some ongoing over-valuation in the housing market, stable B.C. home values are far from assured.

1 21 22 23 24 25 30