BCREA Housing Market Update for October 2017
The BC Real Estate Association (BCREA) Chief Economist Cameron Muir discusses the September 2017 statistics.
MLS Listings, News & Statistics

Real Estate Statistics For Kamloops And The Surrounding Communities
The BC Real Estate Association (BCREA) Chief Economist Cameron Muir discusses the September 2017 statistics.
Vancouver, BC – October 12, 2017. The . The British Columbia Real Estate Association (BCREA) reports that a total of 8,340 residential unit sales were recorded by the Multiple Listing Service® (MLS®) in September, an increase of 9.9 per cent from the same period last year. Total sales dollar volume was $5.8 billion, up 30.2 per cent from September 2016. The average MLS® residential price in the province was $693,774, up 18.5 per cent from September 2016.
 “BC home sales rose nearly 5 per cent from August on a seasonally adjusted basis,” said Cameron Muir, BCREA Chief Economist. “Total active listings on the market continue to trend at ten-year lows in most BC regions, limiting unit sales and pushing home prices higher. While the economic fundamentals support elevated housing demand, rising home prices are eroding affordability, particularly for first-time buyers.”
Year-to-date, BC residential sales dollar volume was down 12.8 per cent to $57.6 billion, when compared with the same period in 2016. Residential unit sales declined 13 per cent to 81,608 units, while the average MLS® residential price was down 0.2 per cent to $705,501.
The Kamloops District Real Estate Association has released the latest Statistics for September 2017. Click on the image below to enlarge or PDF documents included in the links below.
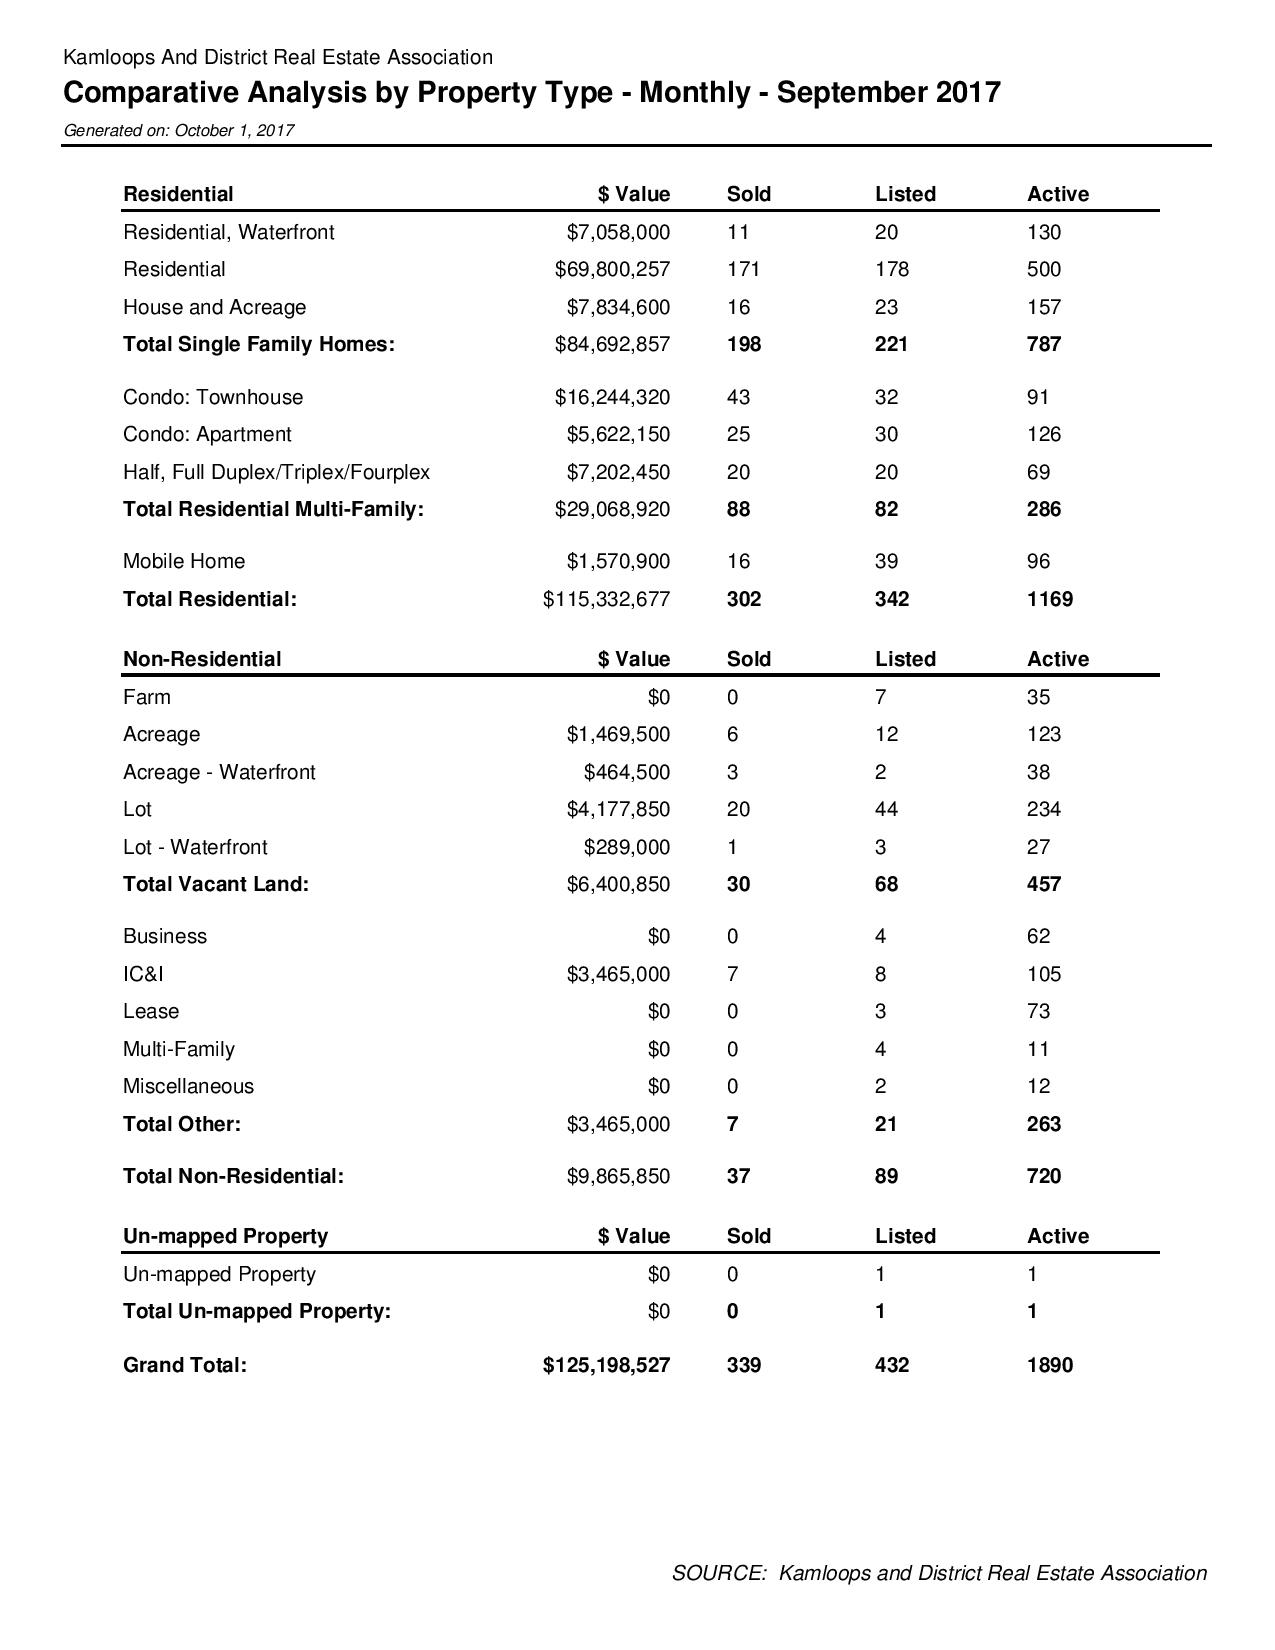
Comparative analysis by property type September 2017
PDF: Comparative analysis by property type September 2017
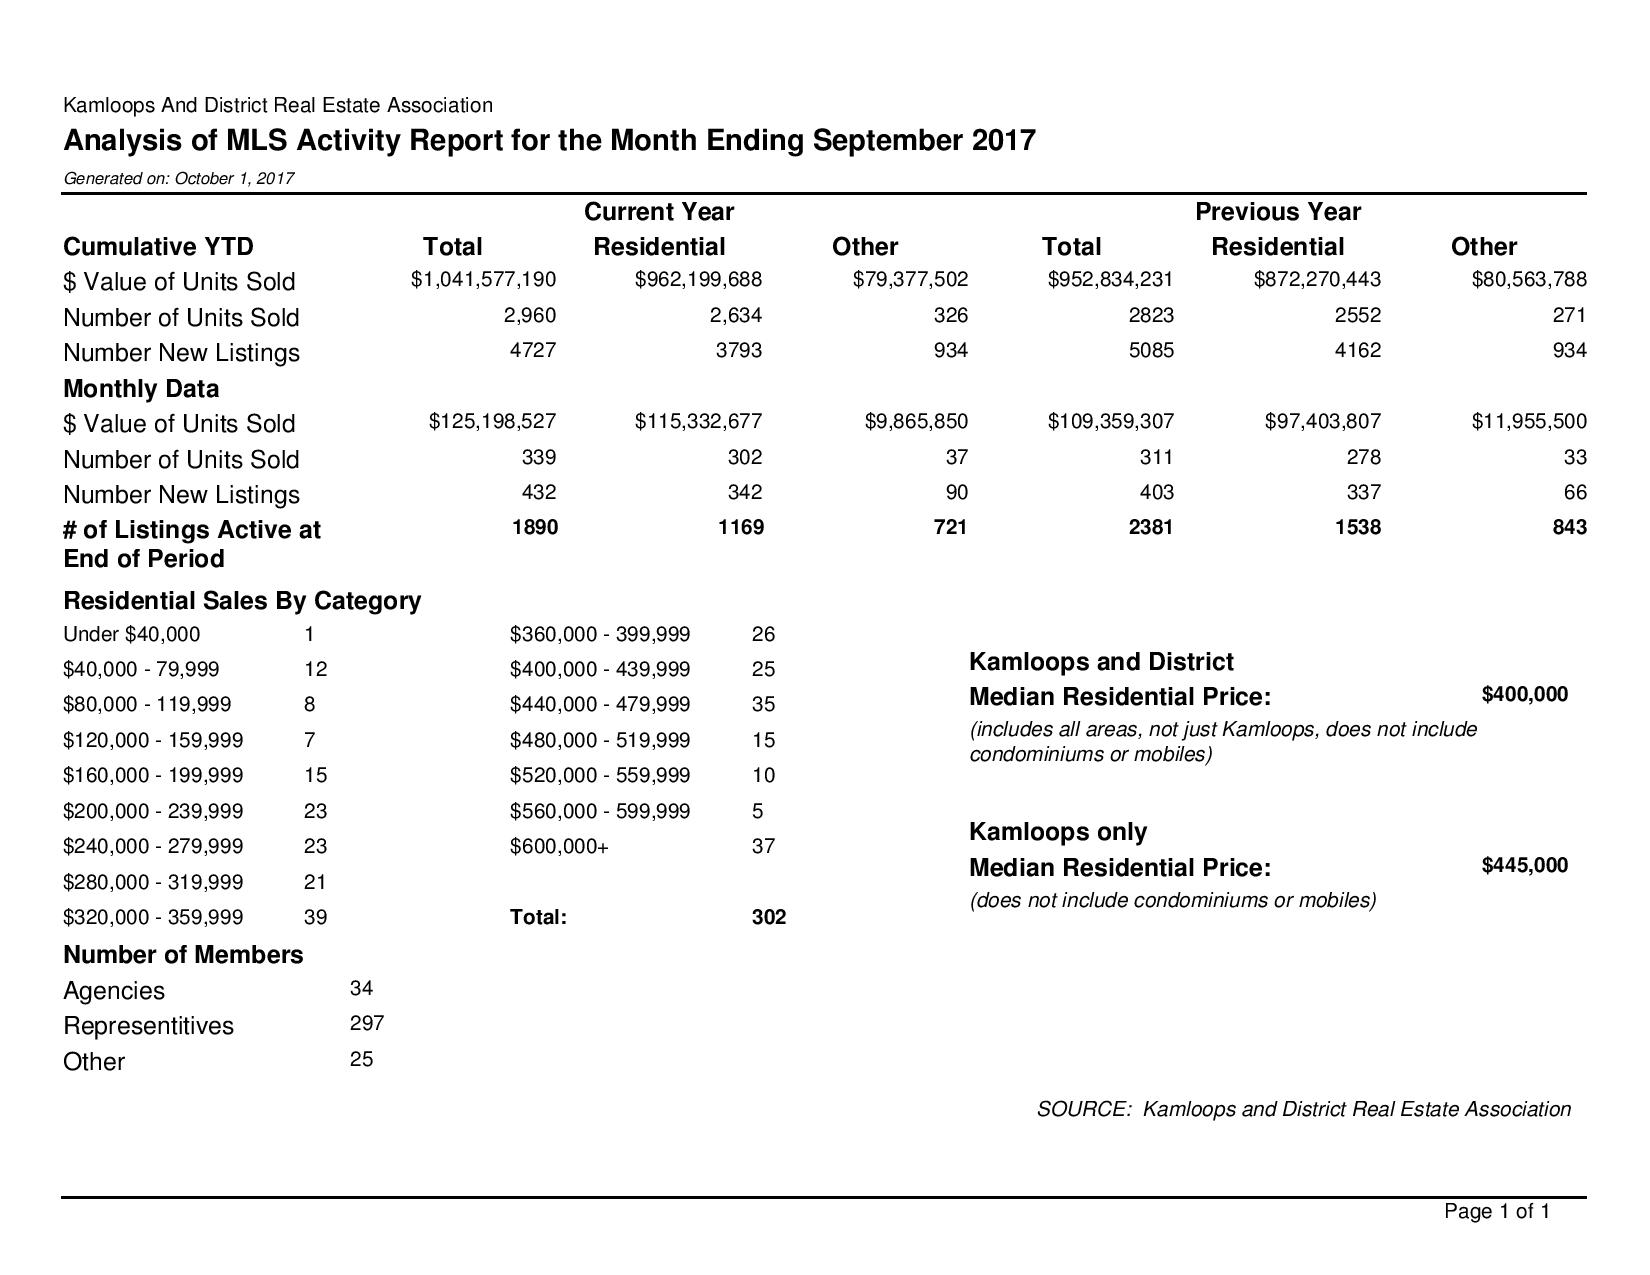
MLS Activity September 2017
PDF: MLS Activity September 2017 Kamloops Real Estate Statistics
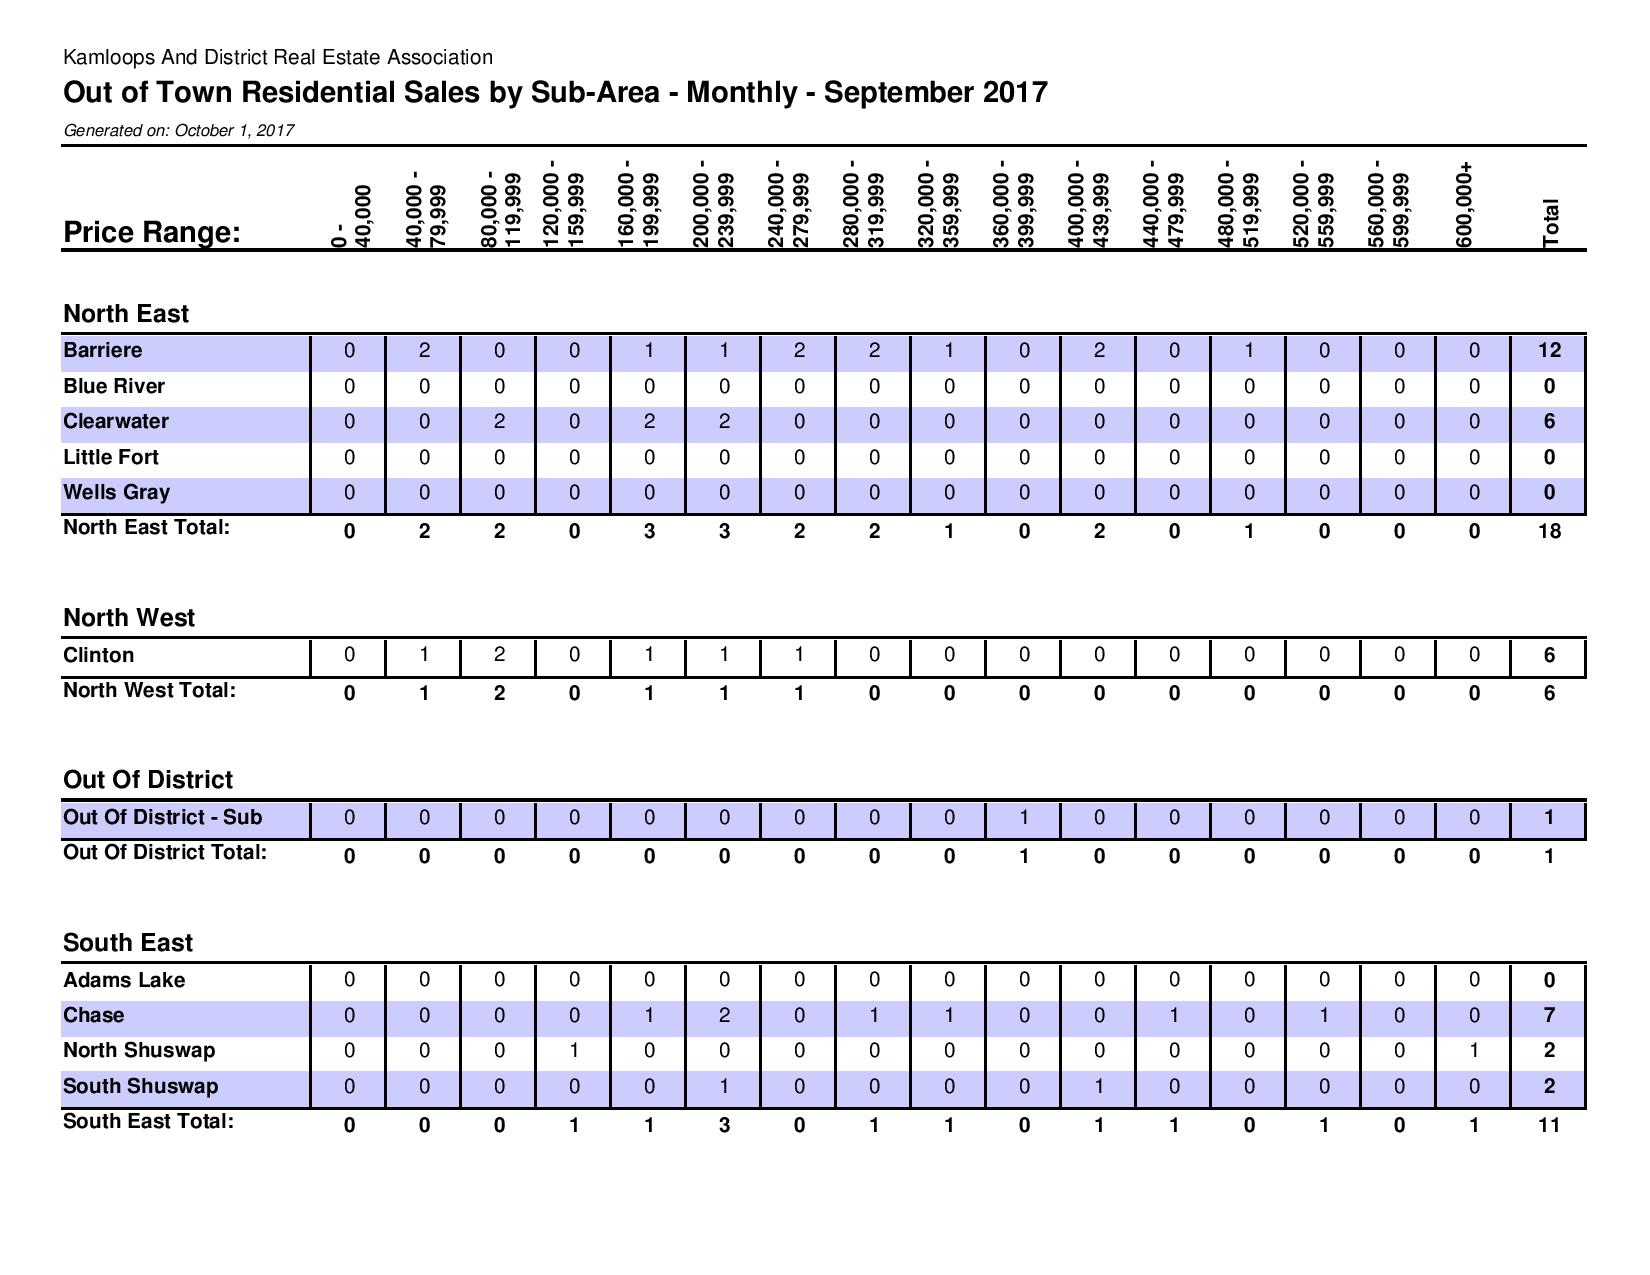
Out of town Sales by Subarea September 2017

Out of town Sales by Subarea September 2017
PDF: Out of town Sales by Subarea September 2017
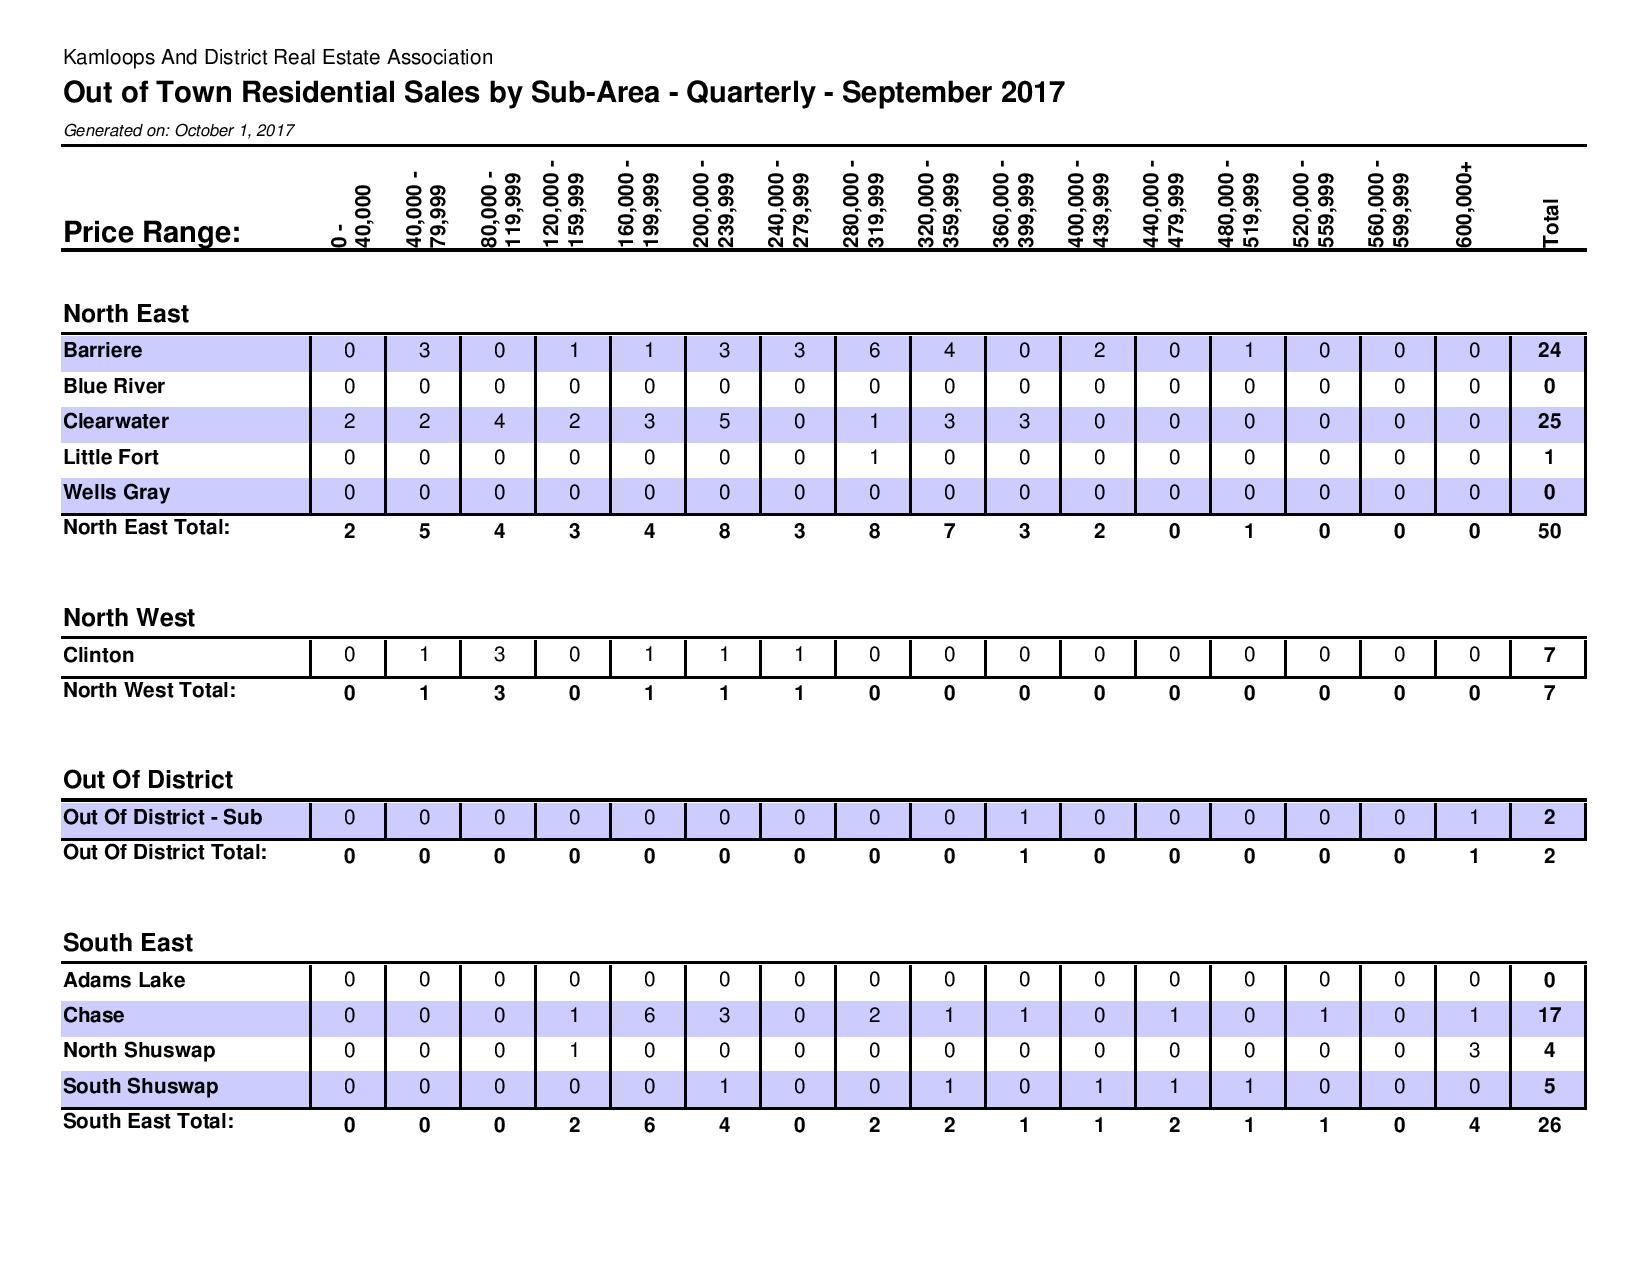
Out of town Sales by Subarea September 2017 Quarterly Third Quarter
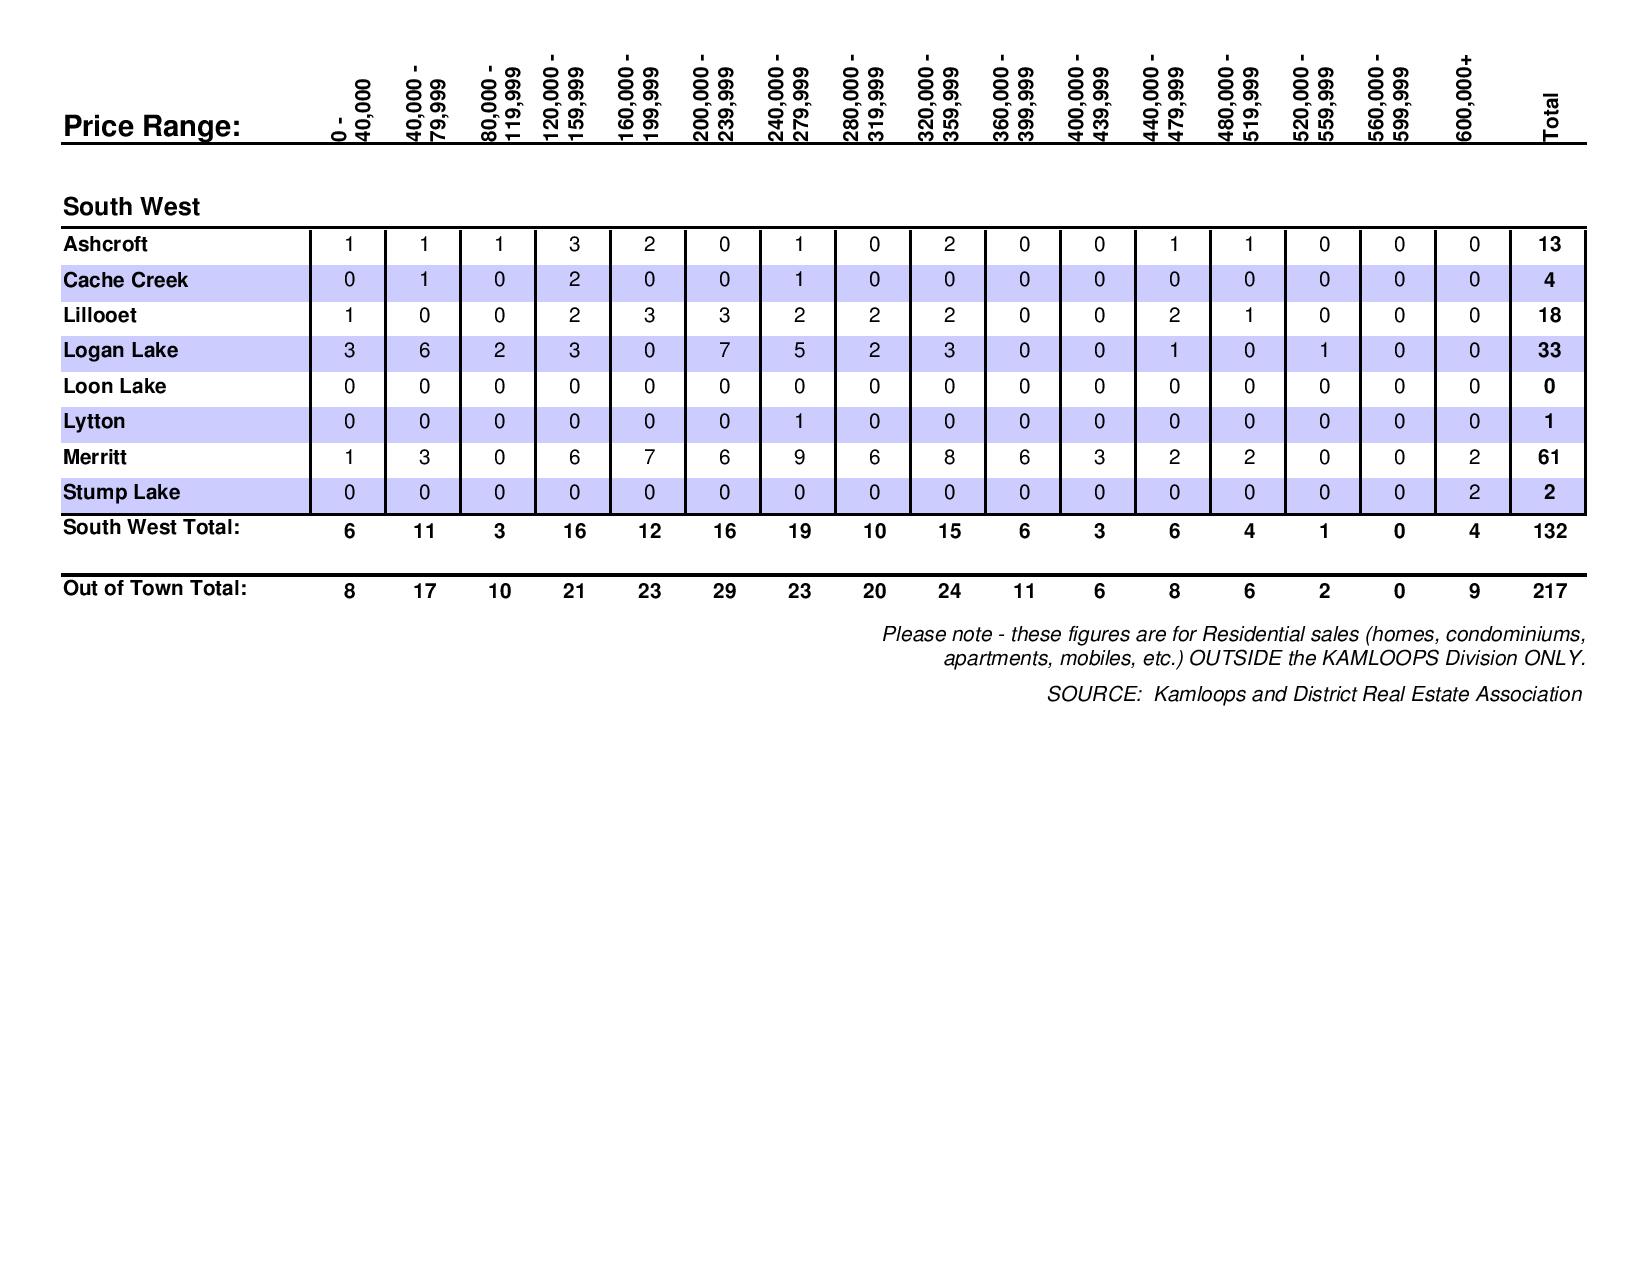
Out of town Sales by Subarea September 2017 Quarterly Third Quarter
PDF: Out of town Sales by Subarea September 2017 Quarterly Third Quarter

Sales by Subarea September 2017
PDF: Sales by Subarea September 2017
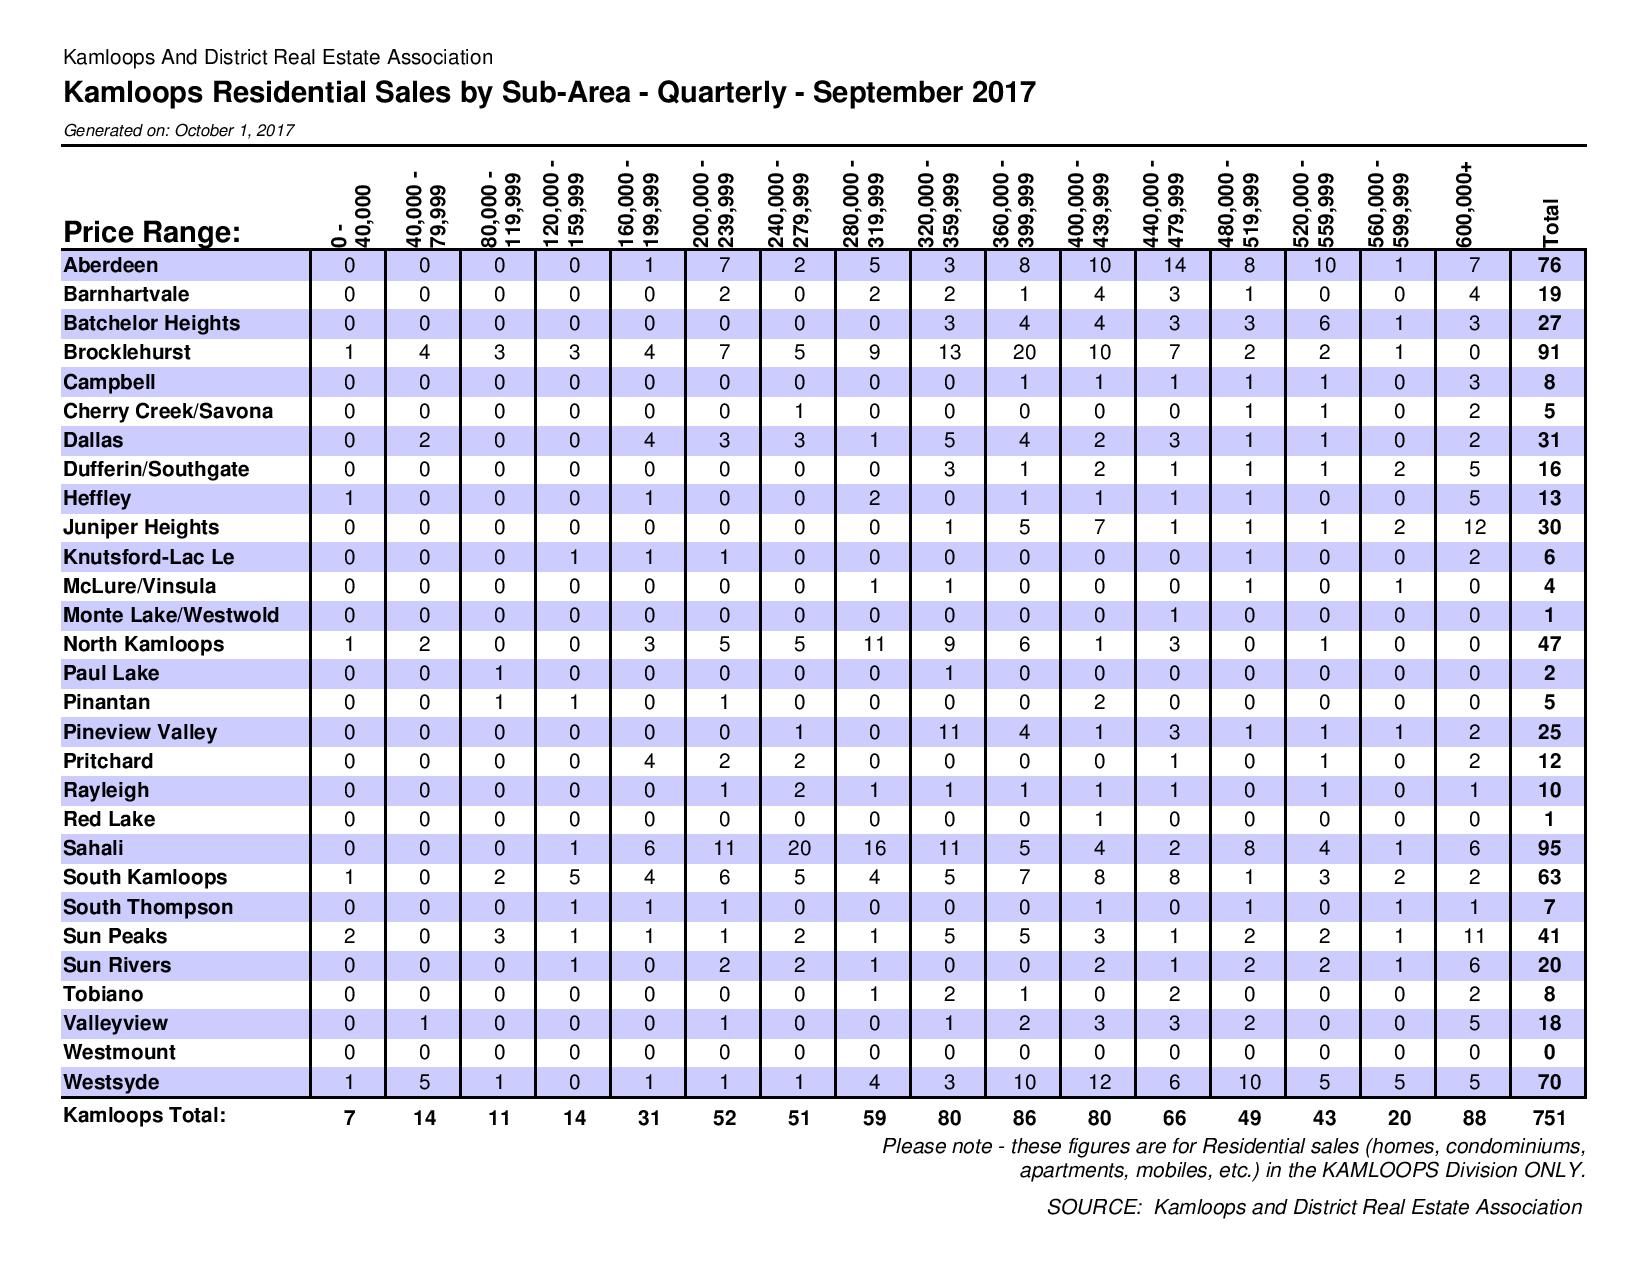
Sales by Subarea Third Quarter 2017
BC Real Estate Association (BCREA) Chief Economist Cameron Muir discusses the August 2017 statistics.