BCREA: Sales Activity Remains Strong Heading Into Spring
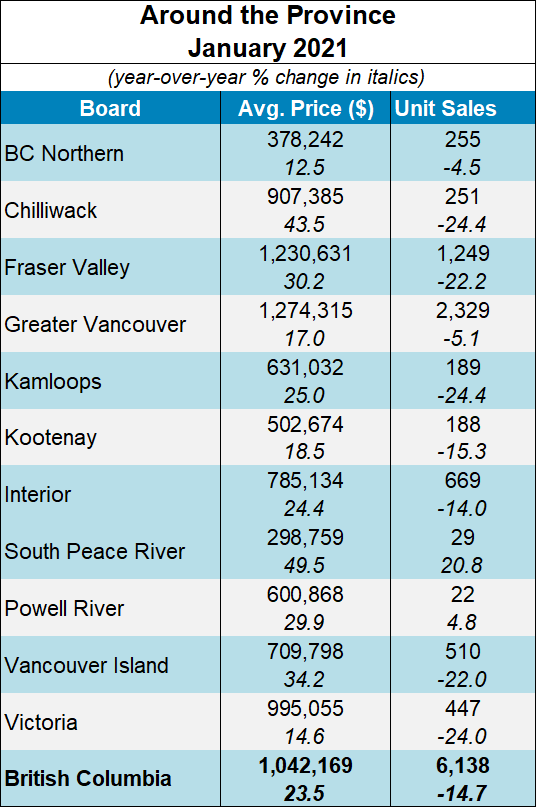
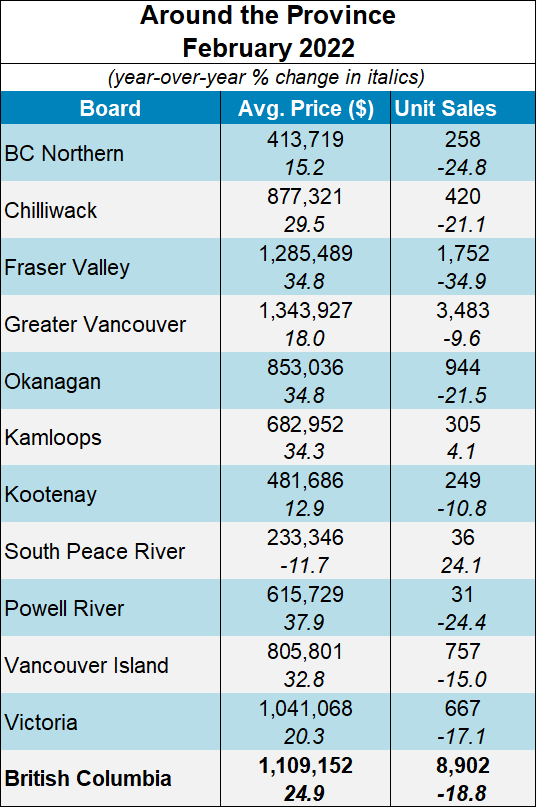
Vancouver, BC – March 14, 2022. The British Columbia Real Estate Association (BCREA) reports that a total of 8,902 residential unit sales were recorded by the Multiple Listing Service® (MLS®) in February 2022, a decrease of 18.8 per cent from February 2021. The average MLS® residential price in BC was $1.109 million, a 24.9 per cent increase from $887,866 recorded in February 2021. Total sales dollar volume was $9.9 billion, a 1.5 per cent increase from the same time last year.
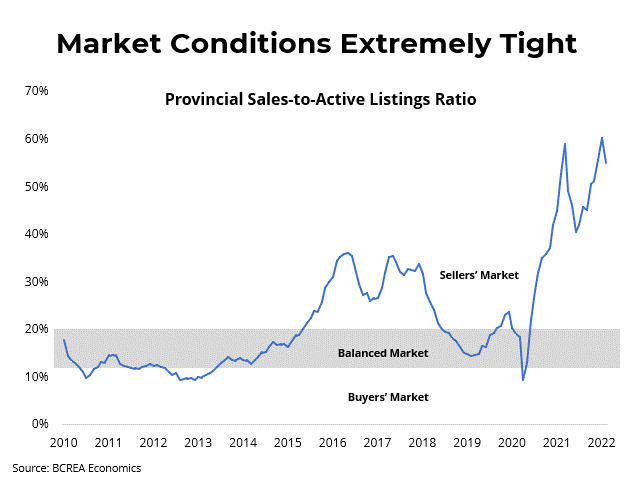
“While sales are not keeping pace with the unprecedented level of activity we saw this time last year, demand continues to be quite strong,” said BCREA Chief Economist Brendon Ogmundson. “There are some encouraging signs that listings are recovering from historical lows, but there is a very long way to go before markets achieve balance.”
Provincial active listings were 19 per cent lower than this time last year with the total inventory of homes for sale in the province at just 16,000 units. That level of inventory is well below the roughly 40,000 listings needed for a balanced market.
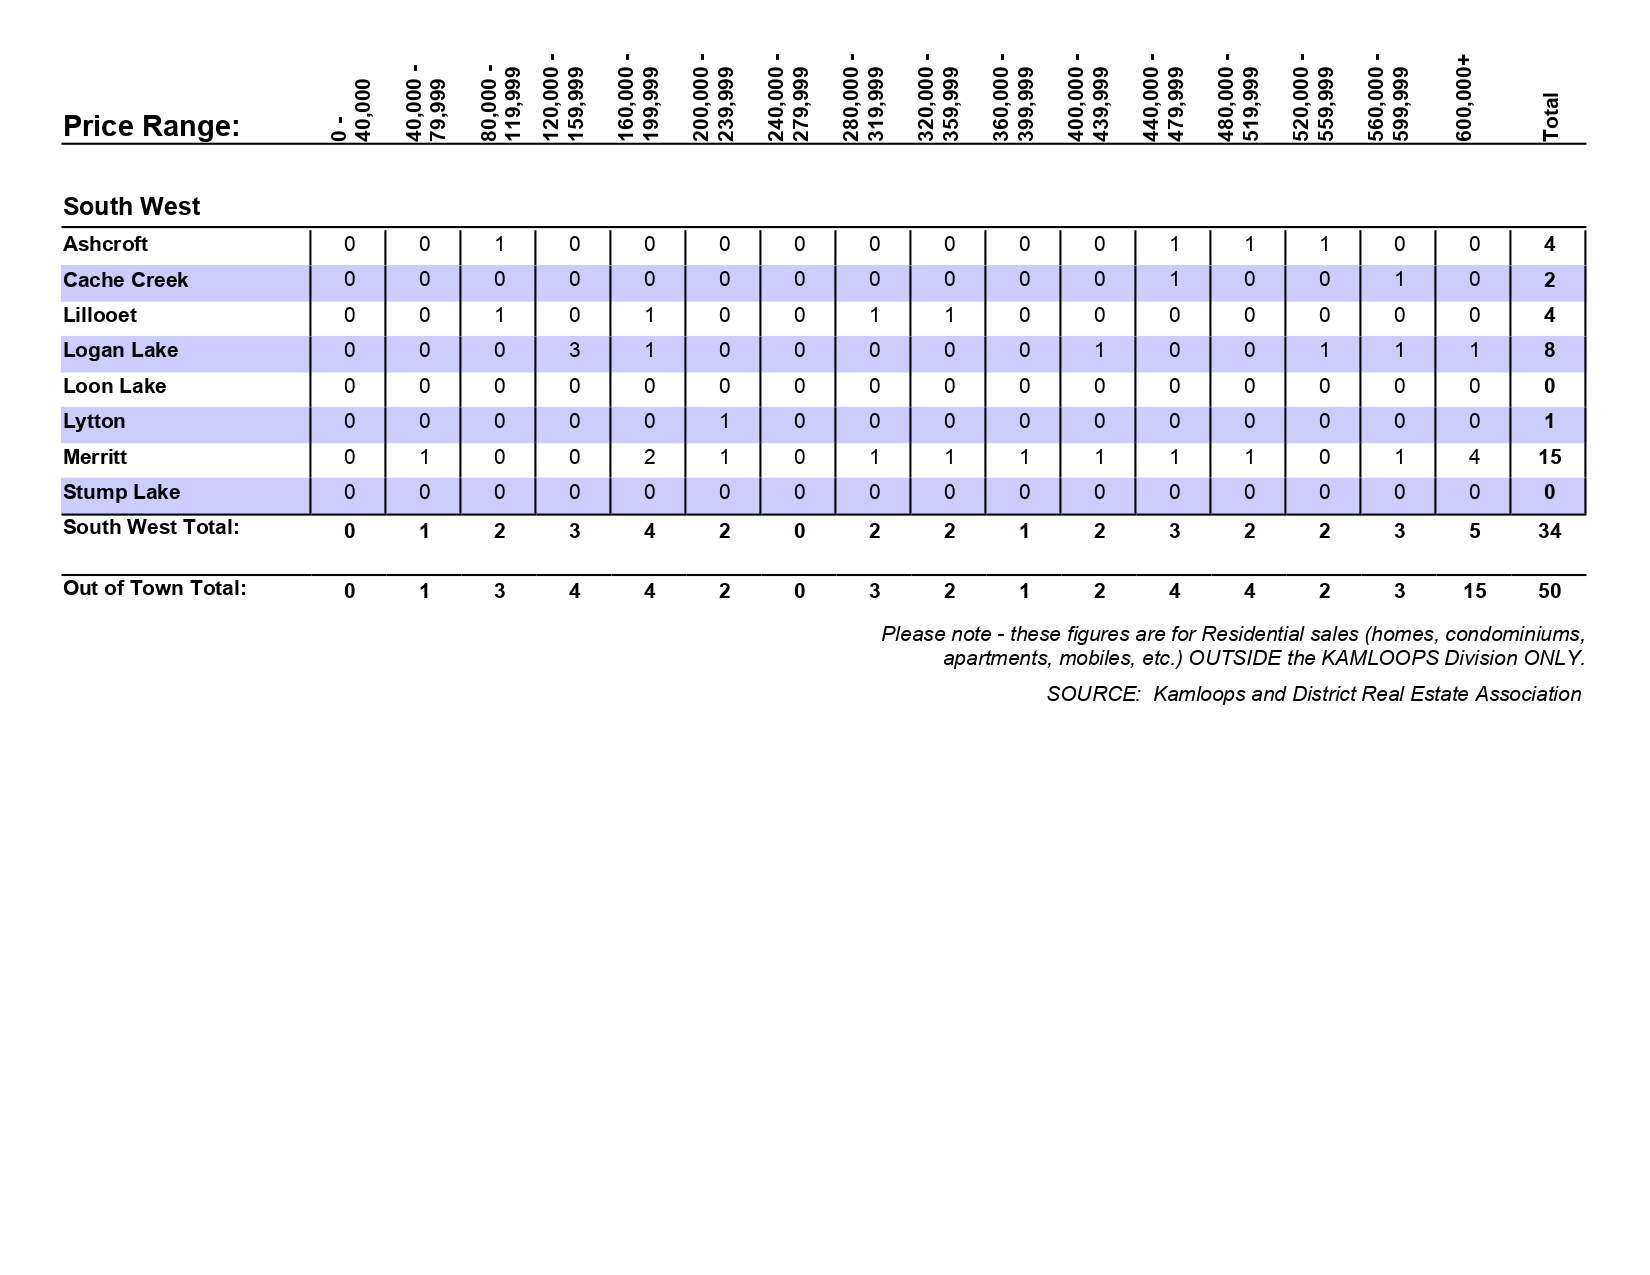
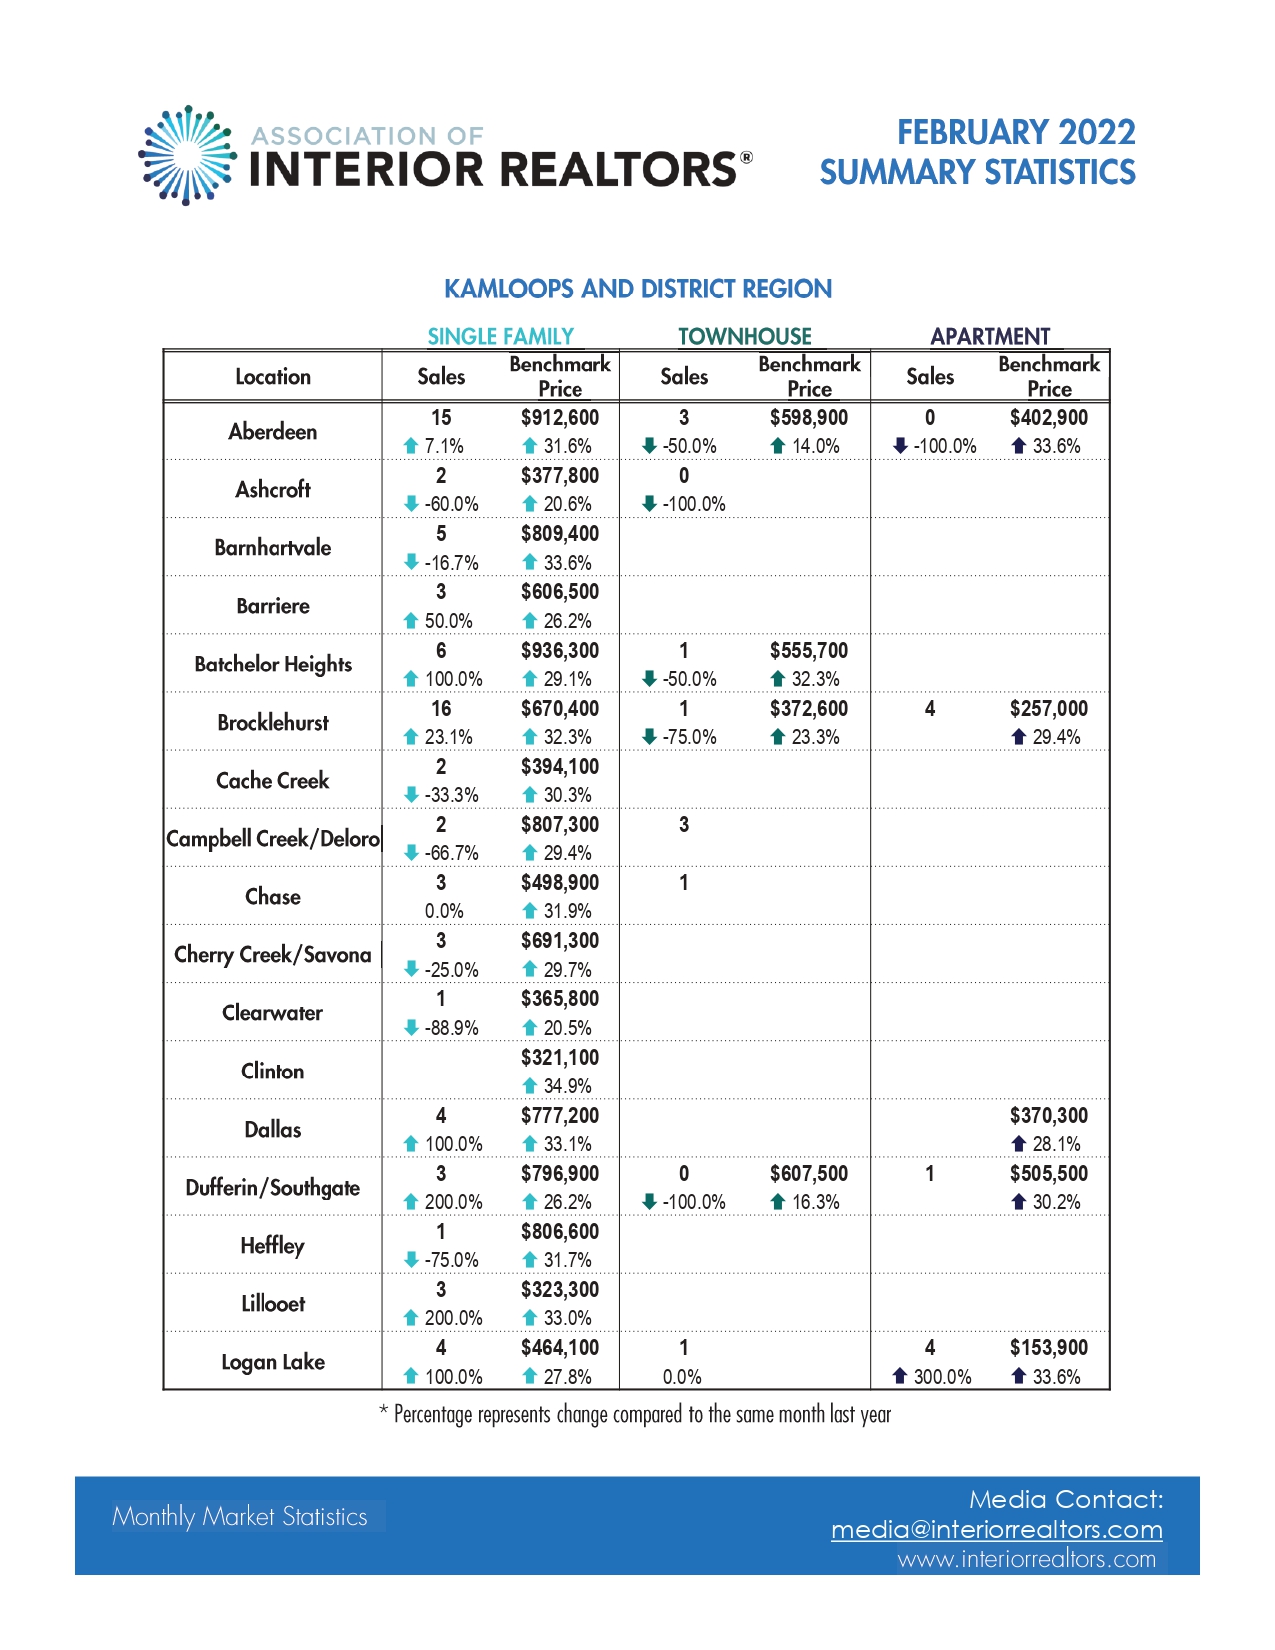
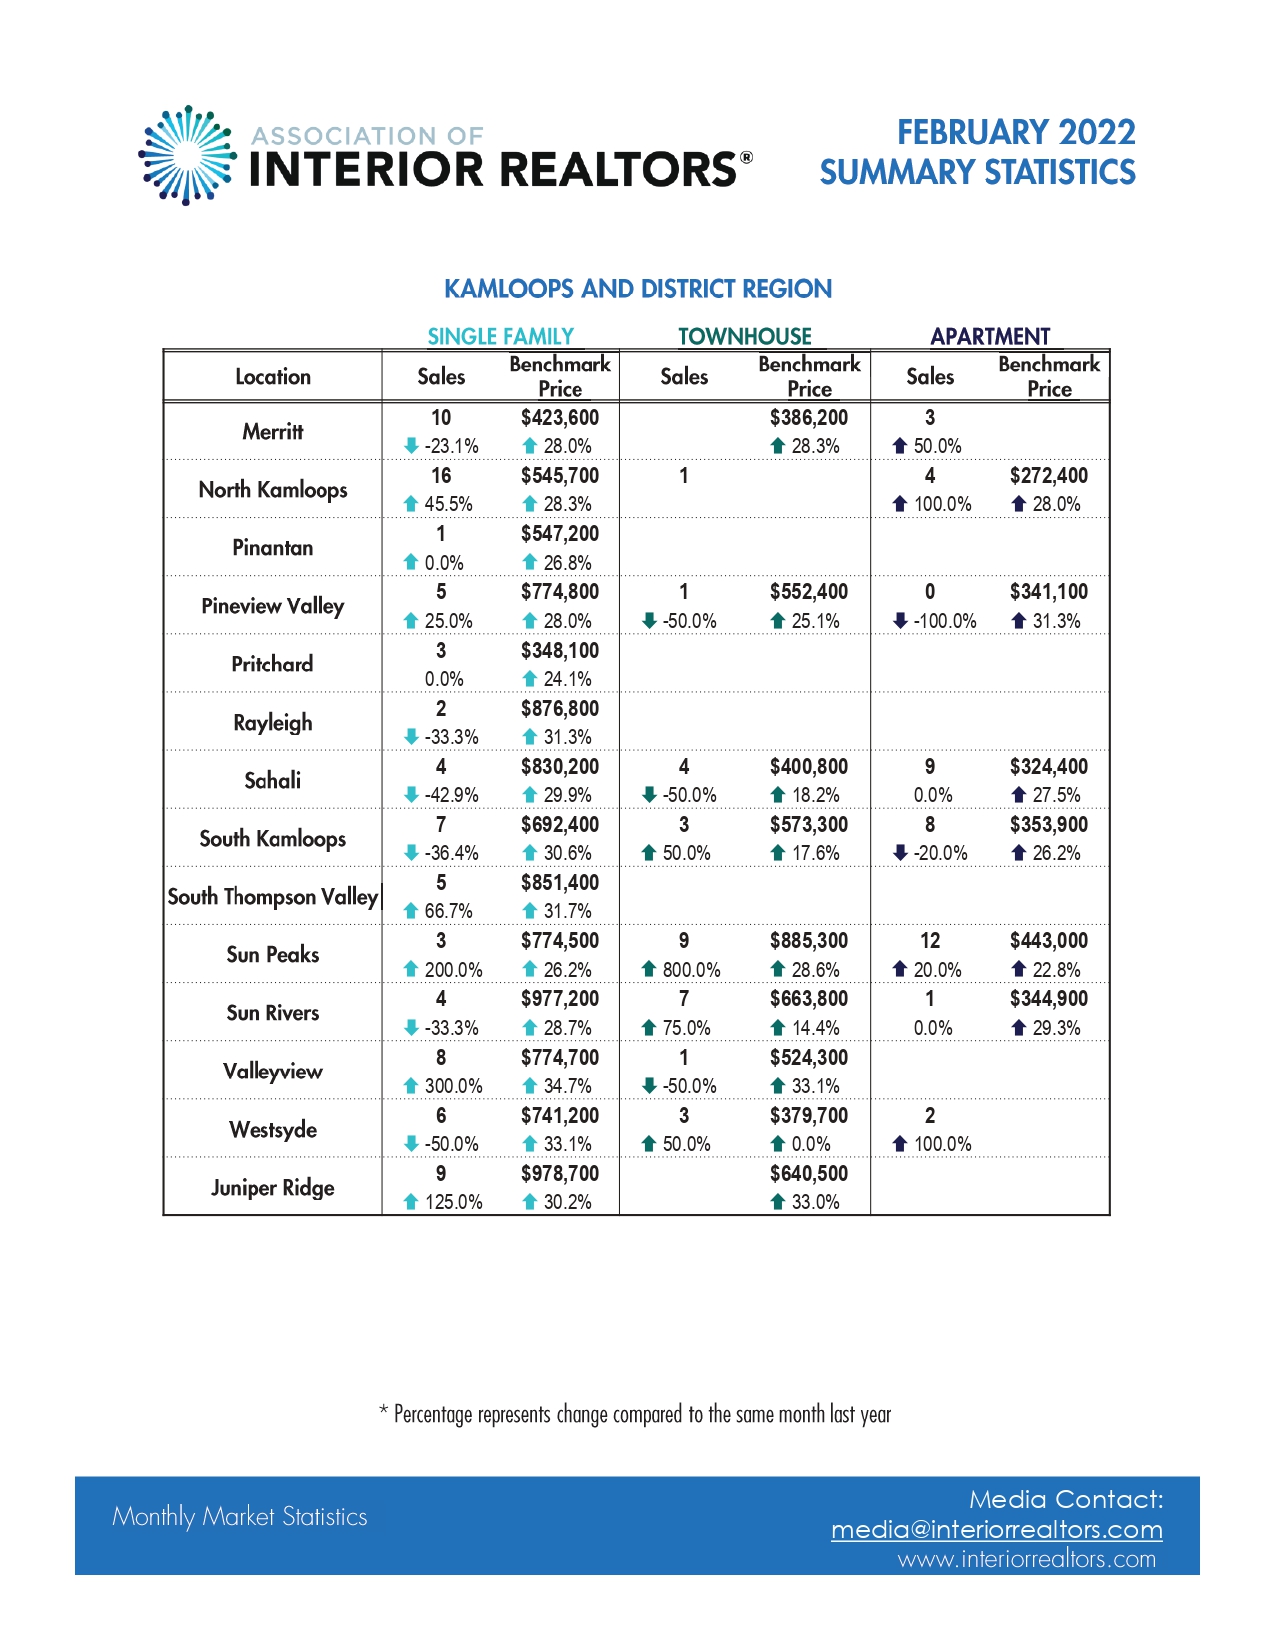
Click here to visit to BCREA’s website. To view other statistics for the Kamloops and BC real estate market click here.
If you want to be kept informed on Kamloops Real Estate, News and more visit our Facebook Page.
To search for Kamloops real estate and homes for sale click here.