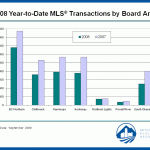
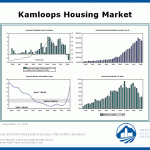
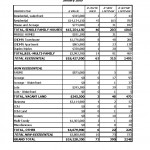
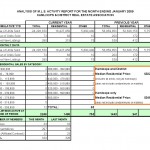
I found this article on the Vancouver Sun’s website today. Provincially the real estate market is feeling the squeeze. The Sun reported that real estate sales are down 58% in the Lower Mainland. In Kamloops, the Kamloops and District Real Estate Association released it’s January statistics and our board is reporting 64% drop in residential sales for the month of January. Read below for the full story, it is focused more on the Lower Mainland, but keep in mind our market is not so different here in Kamloops. We are affected by some of the same economic factors that the Lower Mainland is affected by.
Home sales at lowest point since early 1980s, according to reports
Real estate sales across the Lower Mainland crawled along in January, real estate boards reported Tuesday, with consumers reluctant to buy during recessionary times and with expectations that prices will continue to decline.
In Metro Vancouver, Realtors recorded 762 Multiple-Listing-Service sales in January, down 58 per cent from the same month a year ago, and the so-called benchmark price for a typical detached home down 11 per cent to $659,638 compared with January of 2008.
In the Fraser Valley, Realtors booked a similar 59-per-cent decline in sales at 359, and the so-called benchmark for a typical single-family home down 9.6 per cent from the same month a year ago.
Both the Real Estate Board of Greater Vancouver, which covers most of Metro except Surrey, and the Fraser Valley Real Estate Board, which takes in Surrey and White Rock, said sales were at levels not seen since the early 1980s.
“We’re seeing the same factors at play: uncertainty in people’s minds about where the economy is going and where their jobs are going,” Robyn Adamache, a market analyst with Canada Mortgage and Housing Corp. said in an interview.
“As well, I think at lease some people are expecting further price reductions and perhaps are holding off on buying waiting for that to happen.”
The B.C. Real Estate Association on Monday released its latest forecast that predicted prices will decline 16 per cent in Metro Vancouver over 2009.
Adamache added that January is traditionally a slow sales month and not a month that can be used to gauge how the year will go, but “we’re sort of well below [sales levels] we’ve seen in previous Januarys.”
Both real estate boards also saw inventories of unsold homes decline in January. In Metro Vancouver, covered by the Greater Vancouver board, January new listings were down 30 per cent to 3,700, and current active listings of 13,966 are down 6,000 from October.
However, Adamache said that sales have slowed so much that the months of supply in unsold inventory has crept up to 11 months, the highest it has been in 10 years.
She added that the ratio of sales to new listings has dropped to a level that has not been seen since at least 1984, the first year for which she has records.
In the Fraser Valley, total inventory of unsold homes in January stood at 8,630 units, 26 per cent higher than January 2008, but 30 per cent lower than the record high inventory recorded last September.
Tsur Somerville, director of the centre for urban economics and real estate at the Sauder School of Business at the University of B.C., said it will be later in the year before we know how much the market is still declining, or whether there has been any stabilization.
The reason, Somerville said, is because the year-over-year comparison is with a month that had relatively high sales, and the dramatic drop-off in Vancouver’s markets did not begin until later in the year.
“I think we’re still declining just because the [sale decline] is 60 per cent versus 40 to 50 per cent,” Somerville said in an interview, “but we won’t get a sense of how much and at what rate until later.”
Dave Watt, president of the Real Estate Board of Greater Vancouver, said the last 10 days of January did see realtor showings and sales pick up relative to the beginning of the month.
Watt said the buyers in the market are “back to looking for a home to purchase and are very much thinking long term.”


