B.C. Real Estate Association Market At A Glance
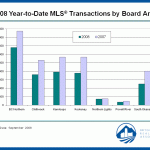
 Here are some charts that the B.C. Real Estate Association has released. I personally find it helpful to see statistics as an image or chart, sometimes just numbers are not enough. The first chart is a comparison of all the smaller boards throughout B.C. Kamloops is one of the mid-sized boards among the smaller markets. As you will see in this chart, the Kootenays, Kamloops and Chilliwack appear to be very similar in the amount of activity for MLS listing sales. You can click on the image to enlarge it.
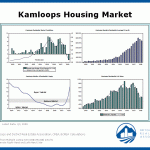
 This next set of 4 graphs shows the direction of the market. From left to right the graphs read Kamloops Residential Market Conditions, Kamloops Quarterly Residential Price, Kamloops Months of Residential Supply and finally bottom right Kamloops Residential Unit Sales. It is interesting to see the sales to active listings ratio in the first graph and how the lines flipped to the downside suddenly. I think that this flip took a lot of people by surprise. The bottom left chart shows the strong buyers market that we are in and how it shot up mid to late 2008.