Kamloops District Real Estate Associations Statistics For September & Quarter Three 2022
The Association of Interior Realtors has released the latest Statistics for September & Quarter Three 2022. Click on the image below to enlarge or PDF documents included in the links below.
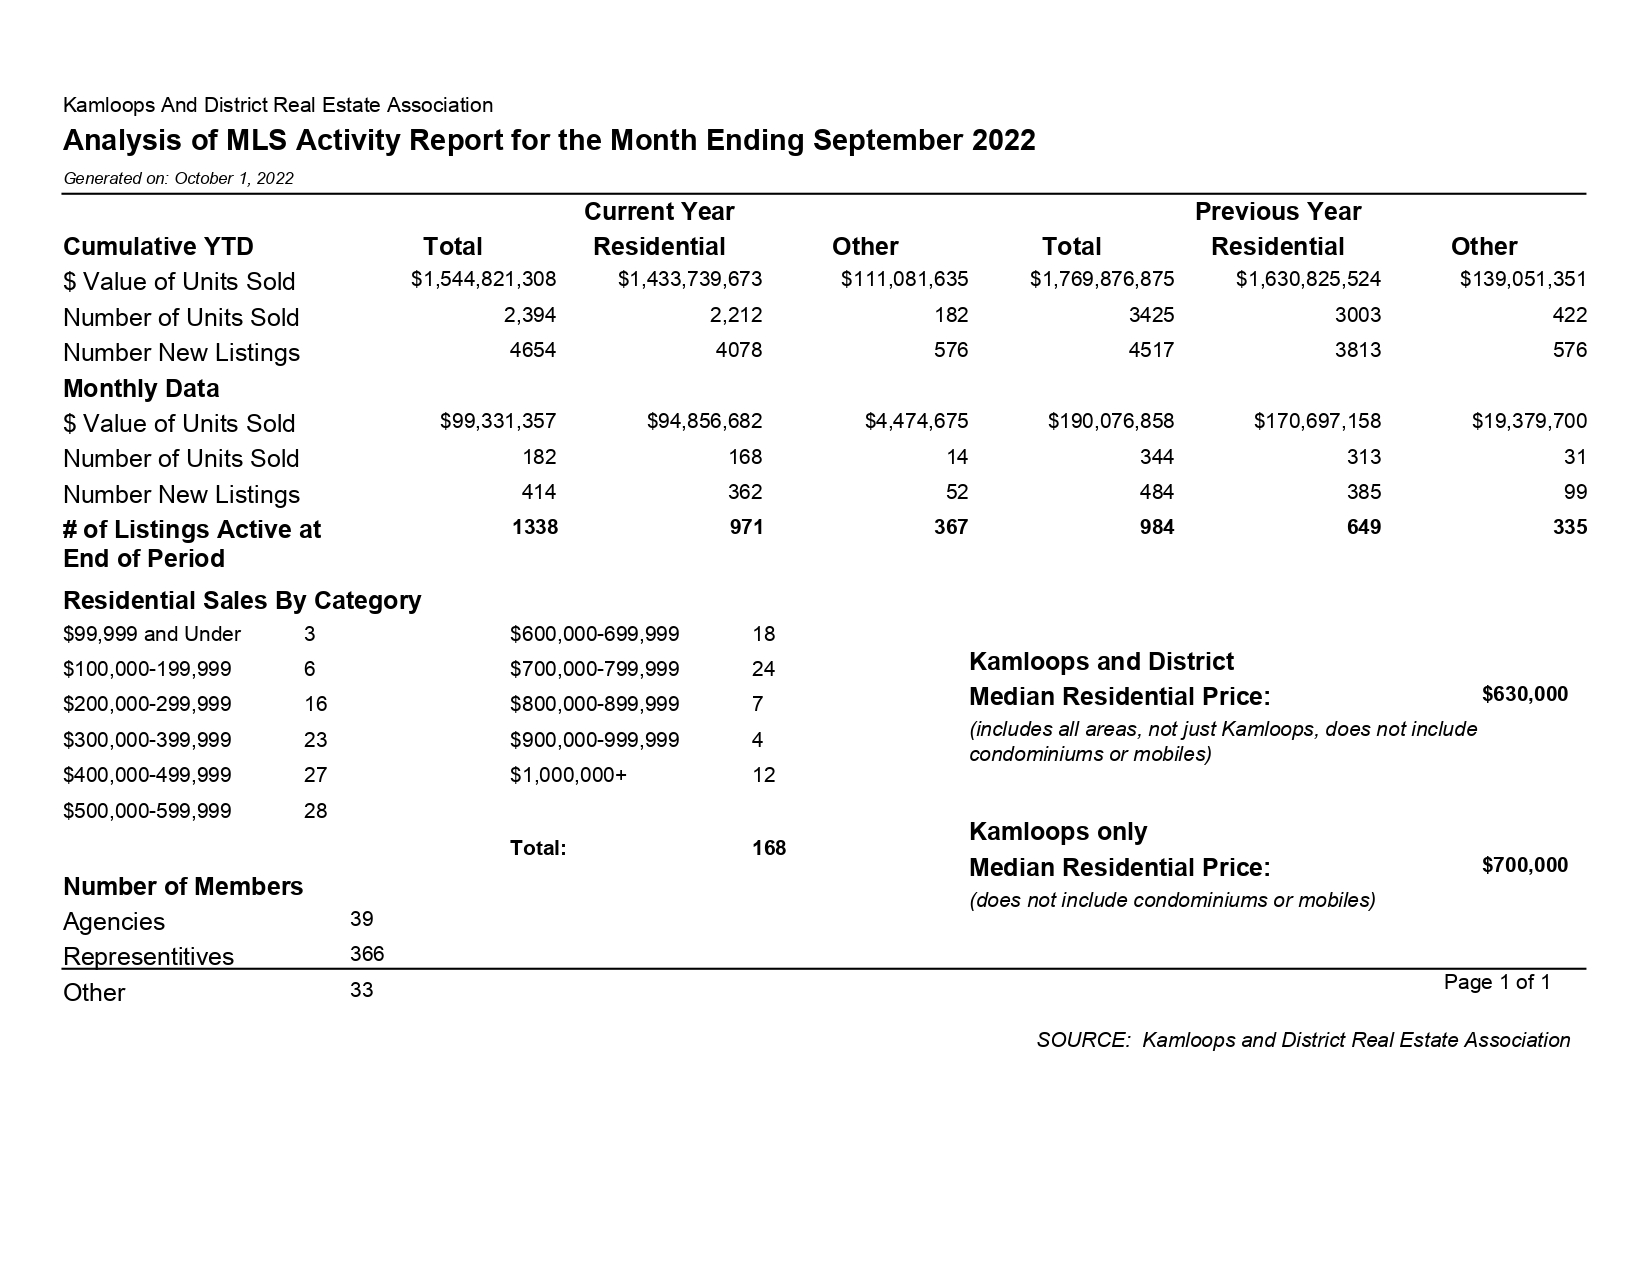
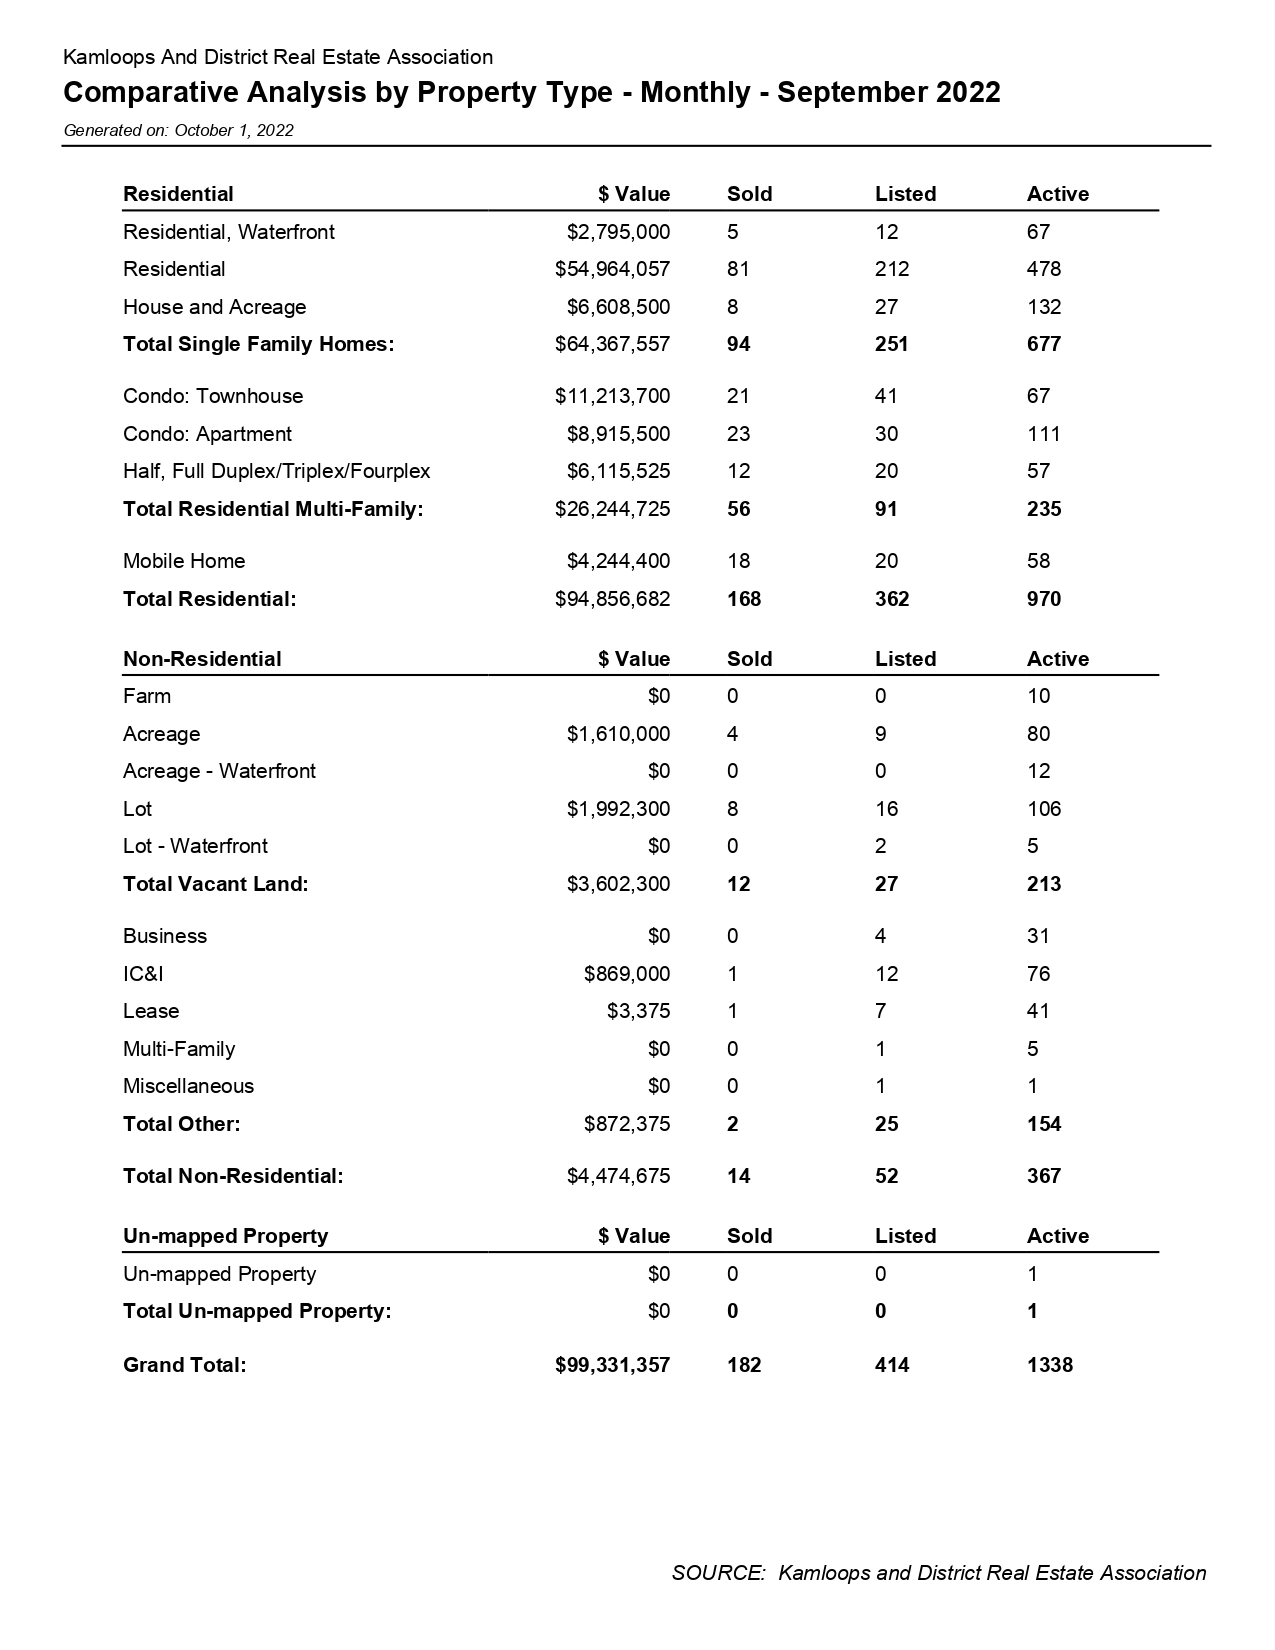
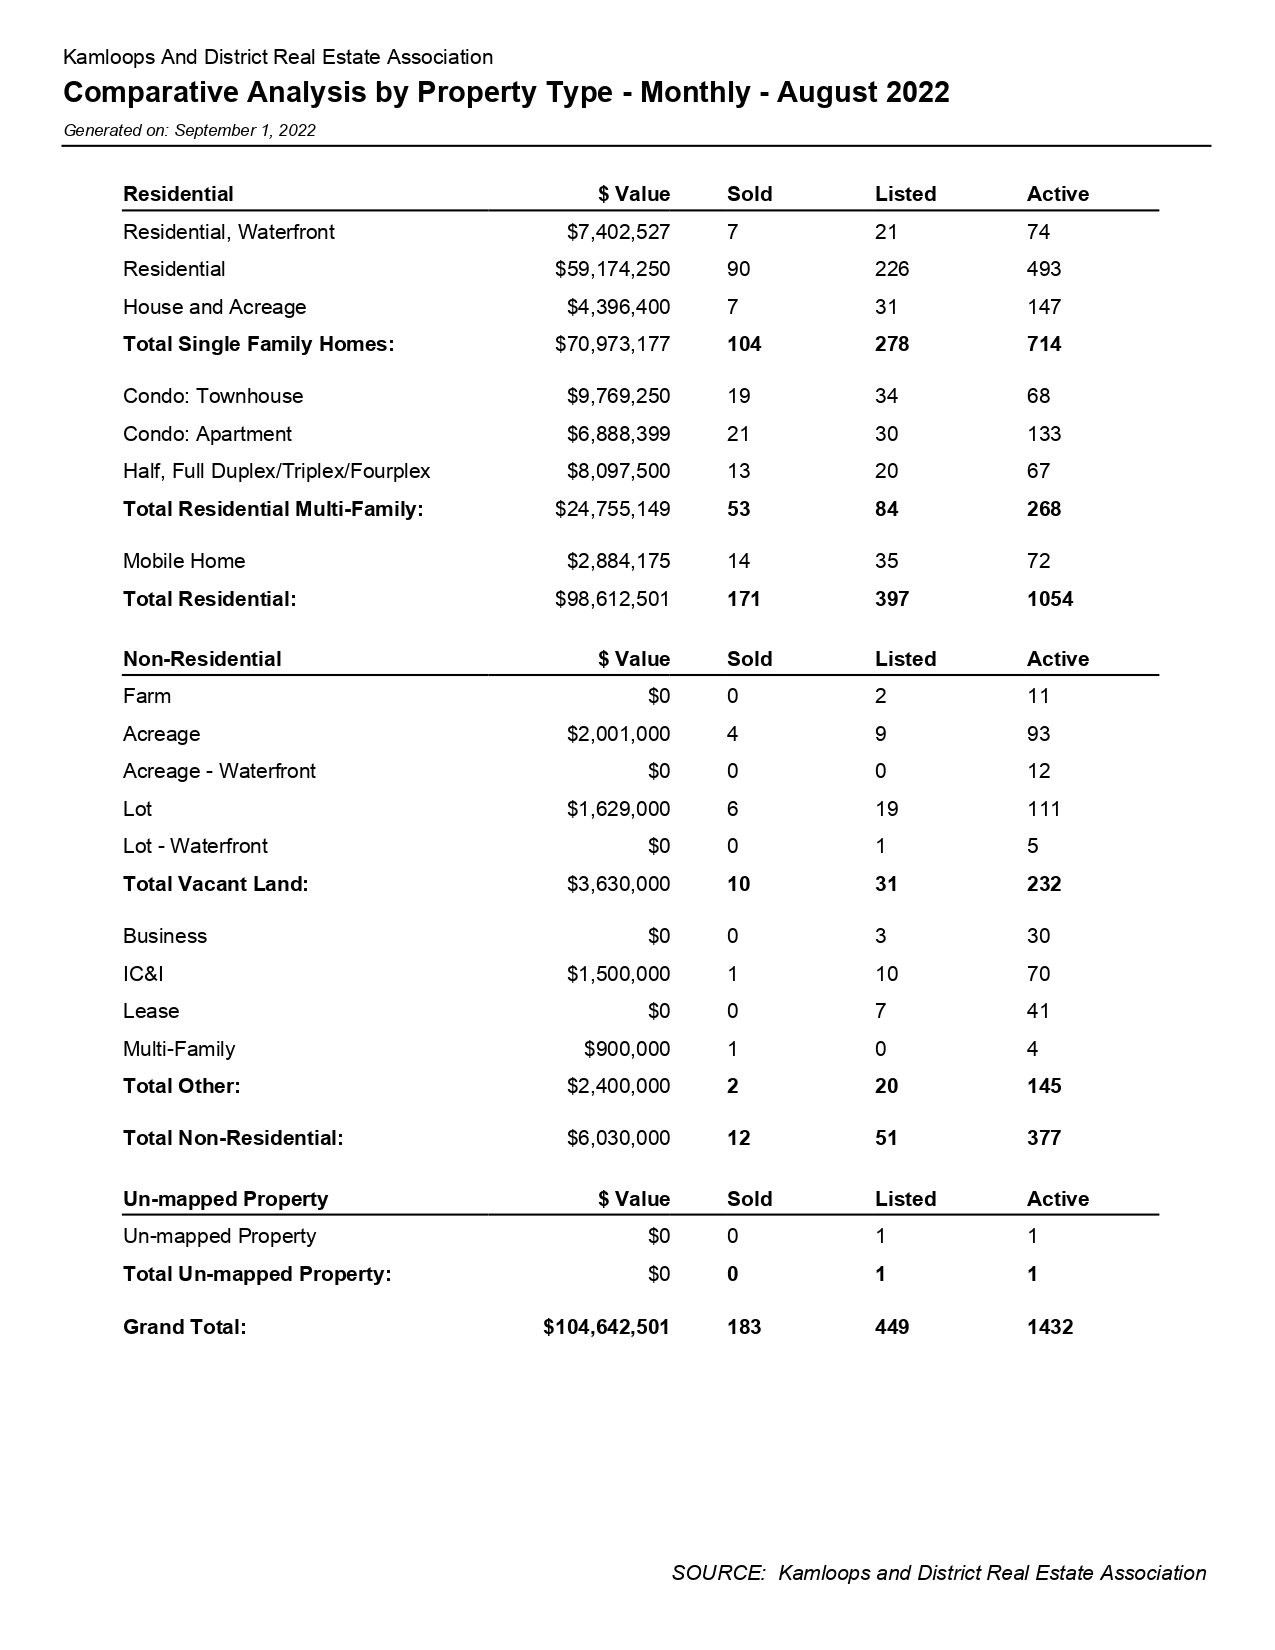
PDF: Comparative Analysis – Sept 2022
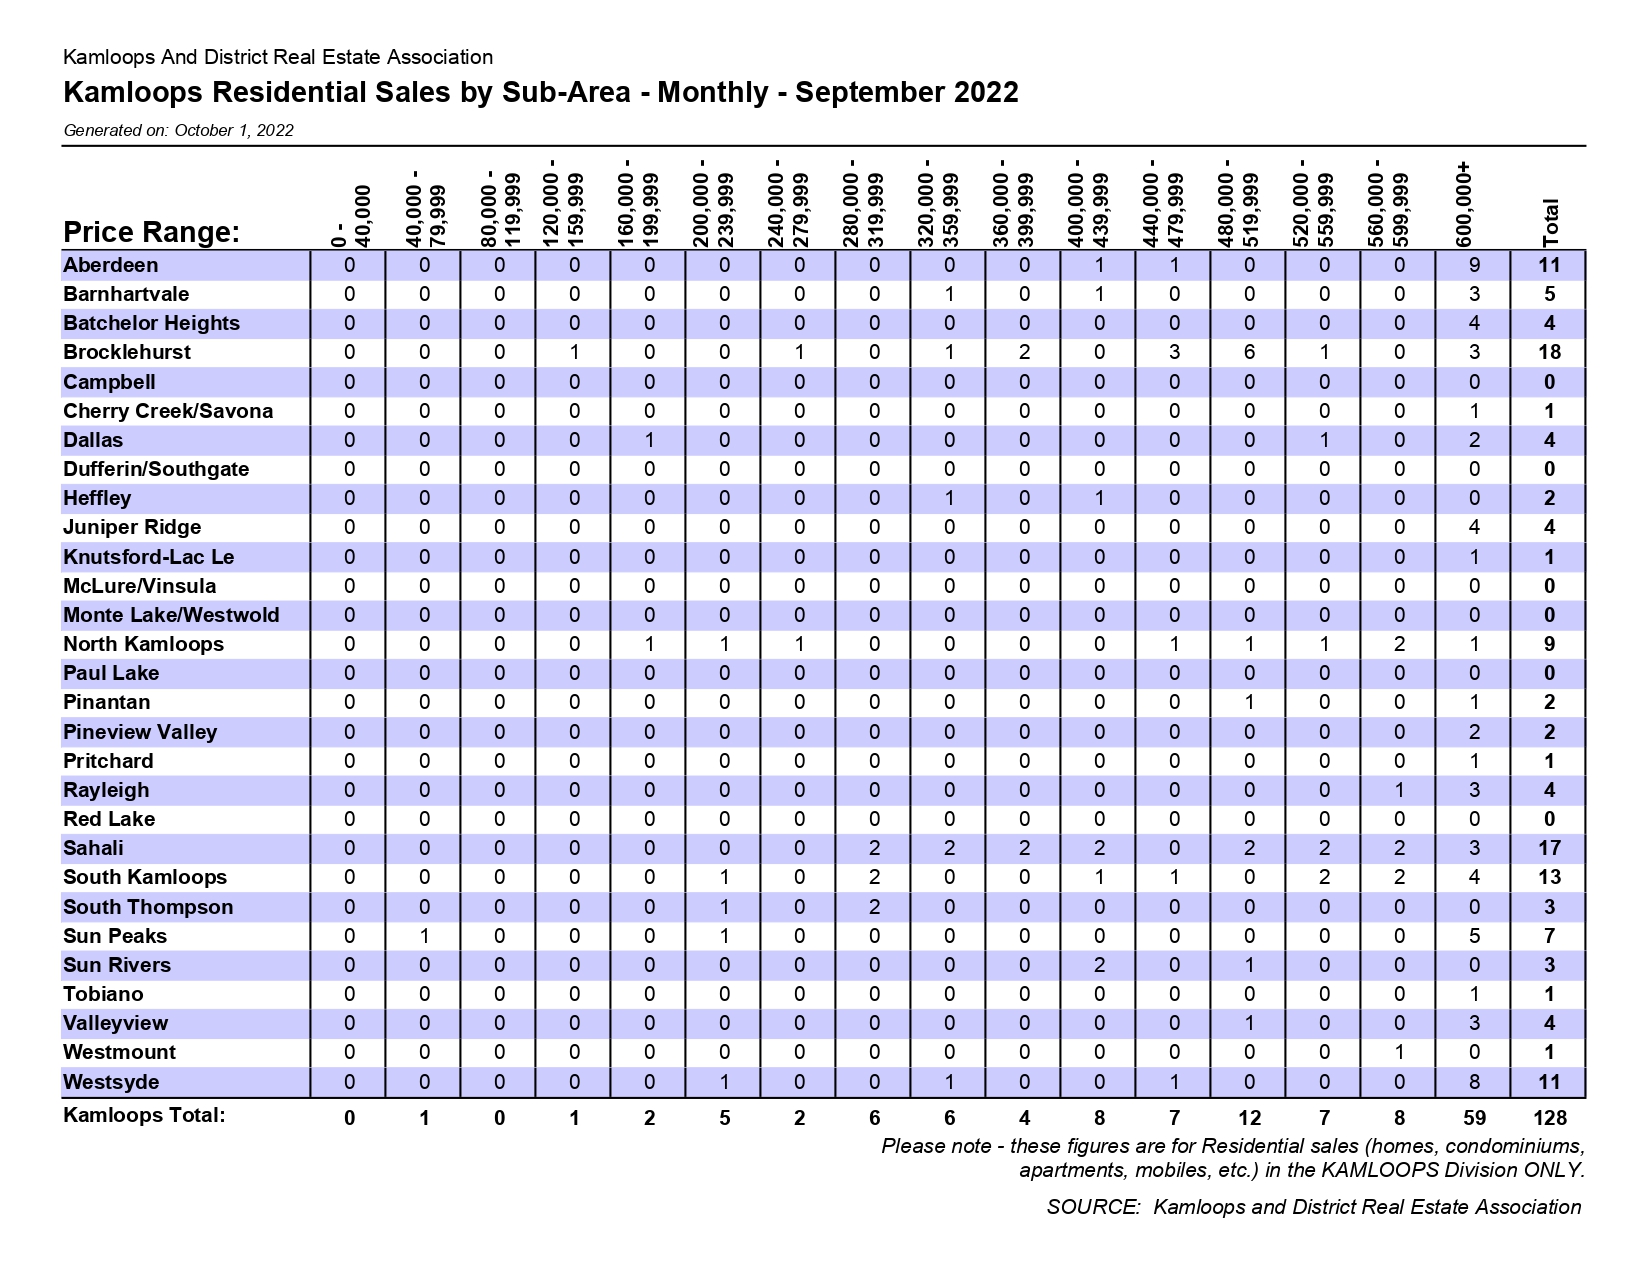
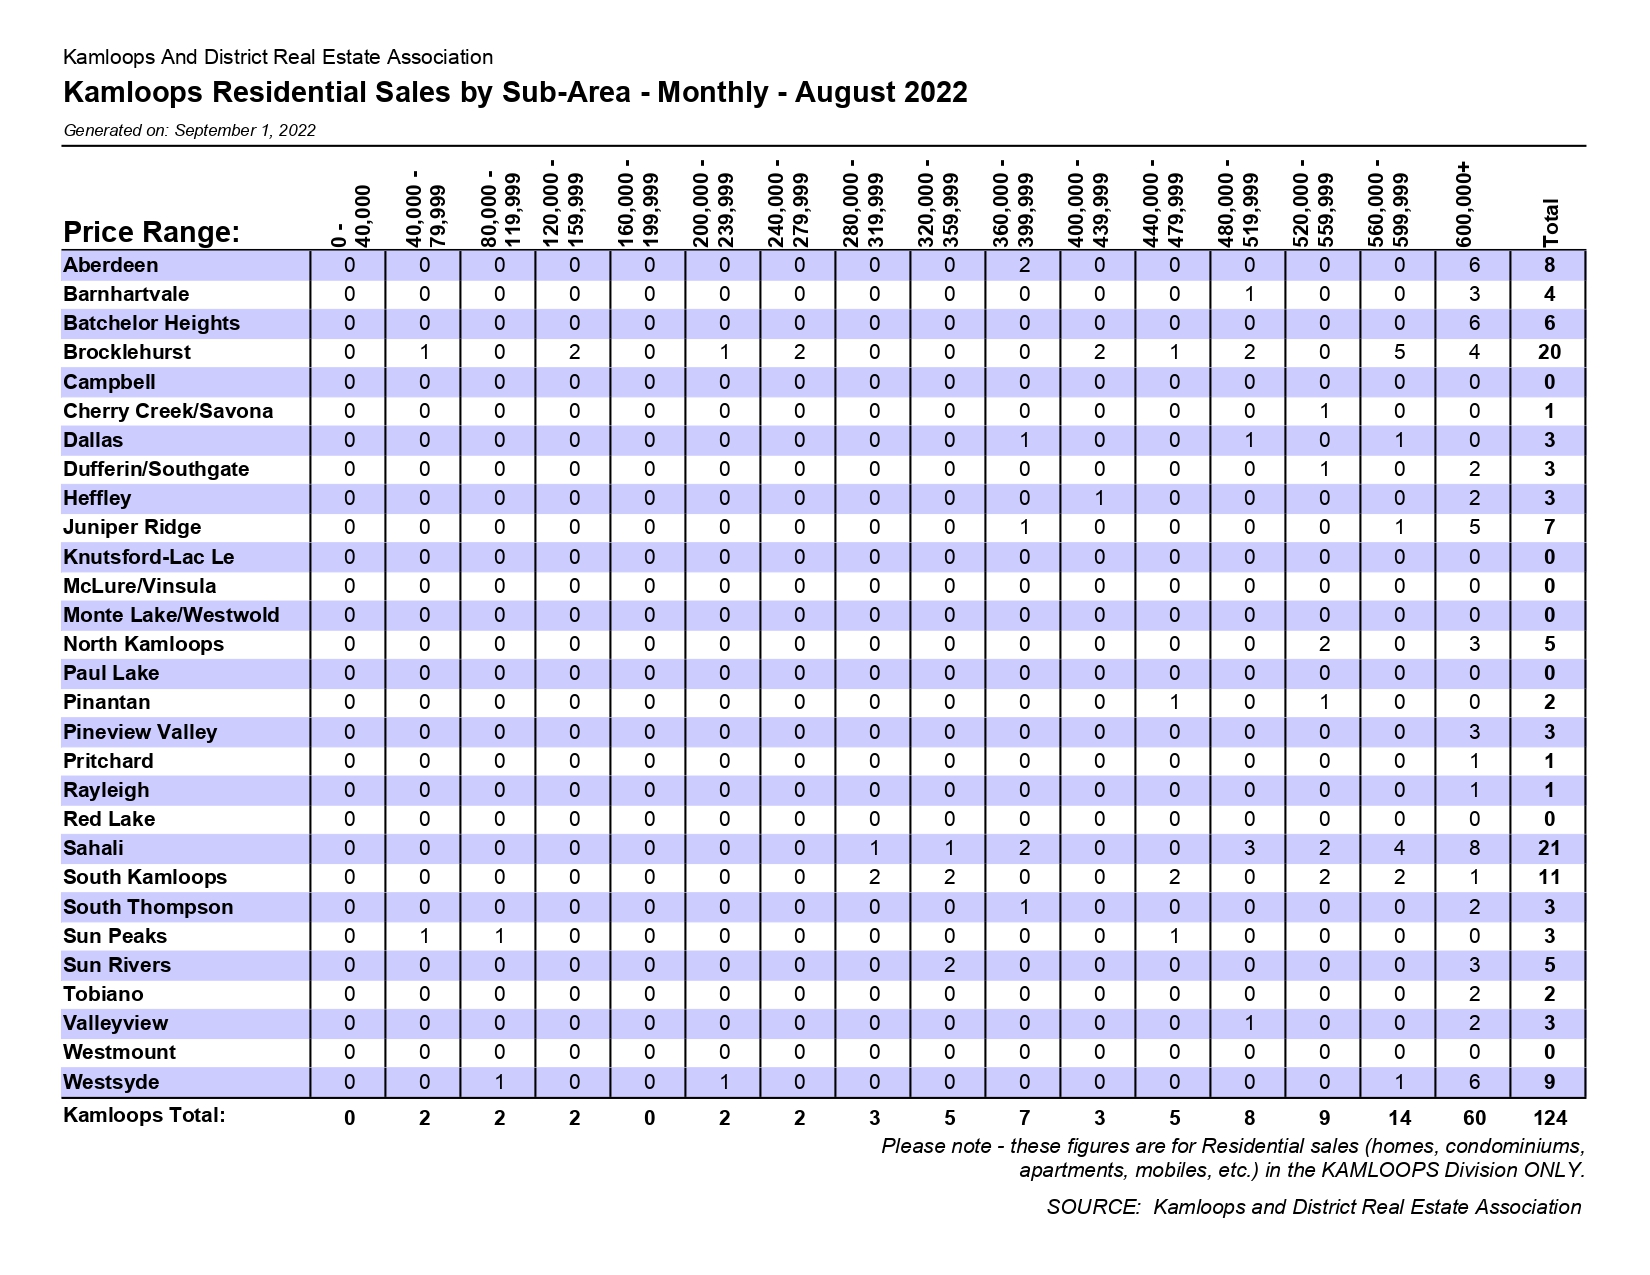
PDF: Residential Sales by Sub-Area – Sept 2022
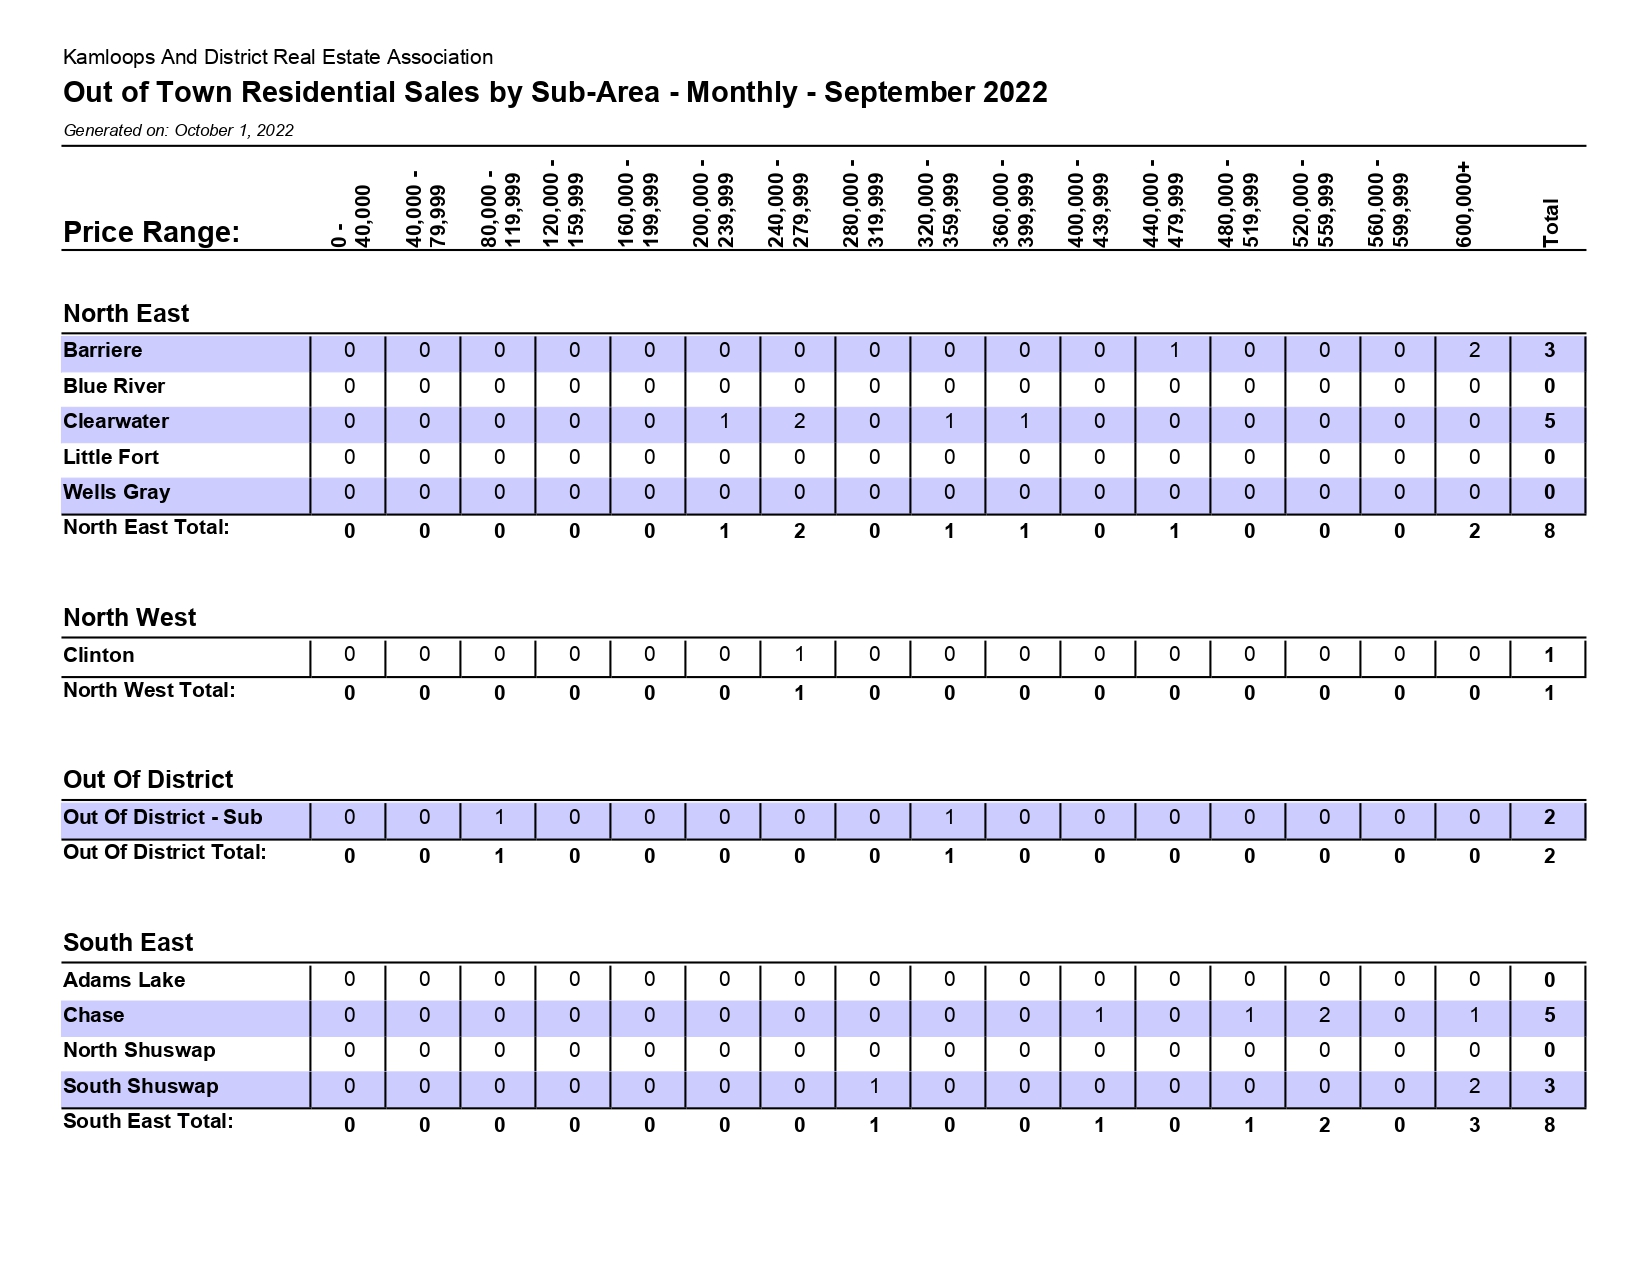
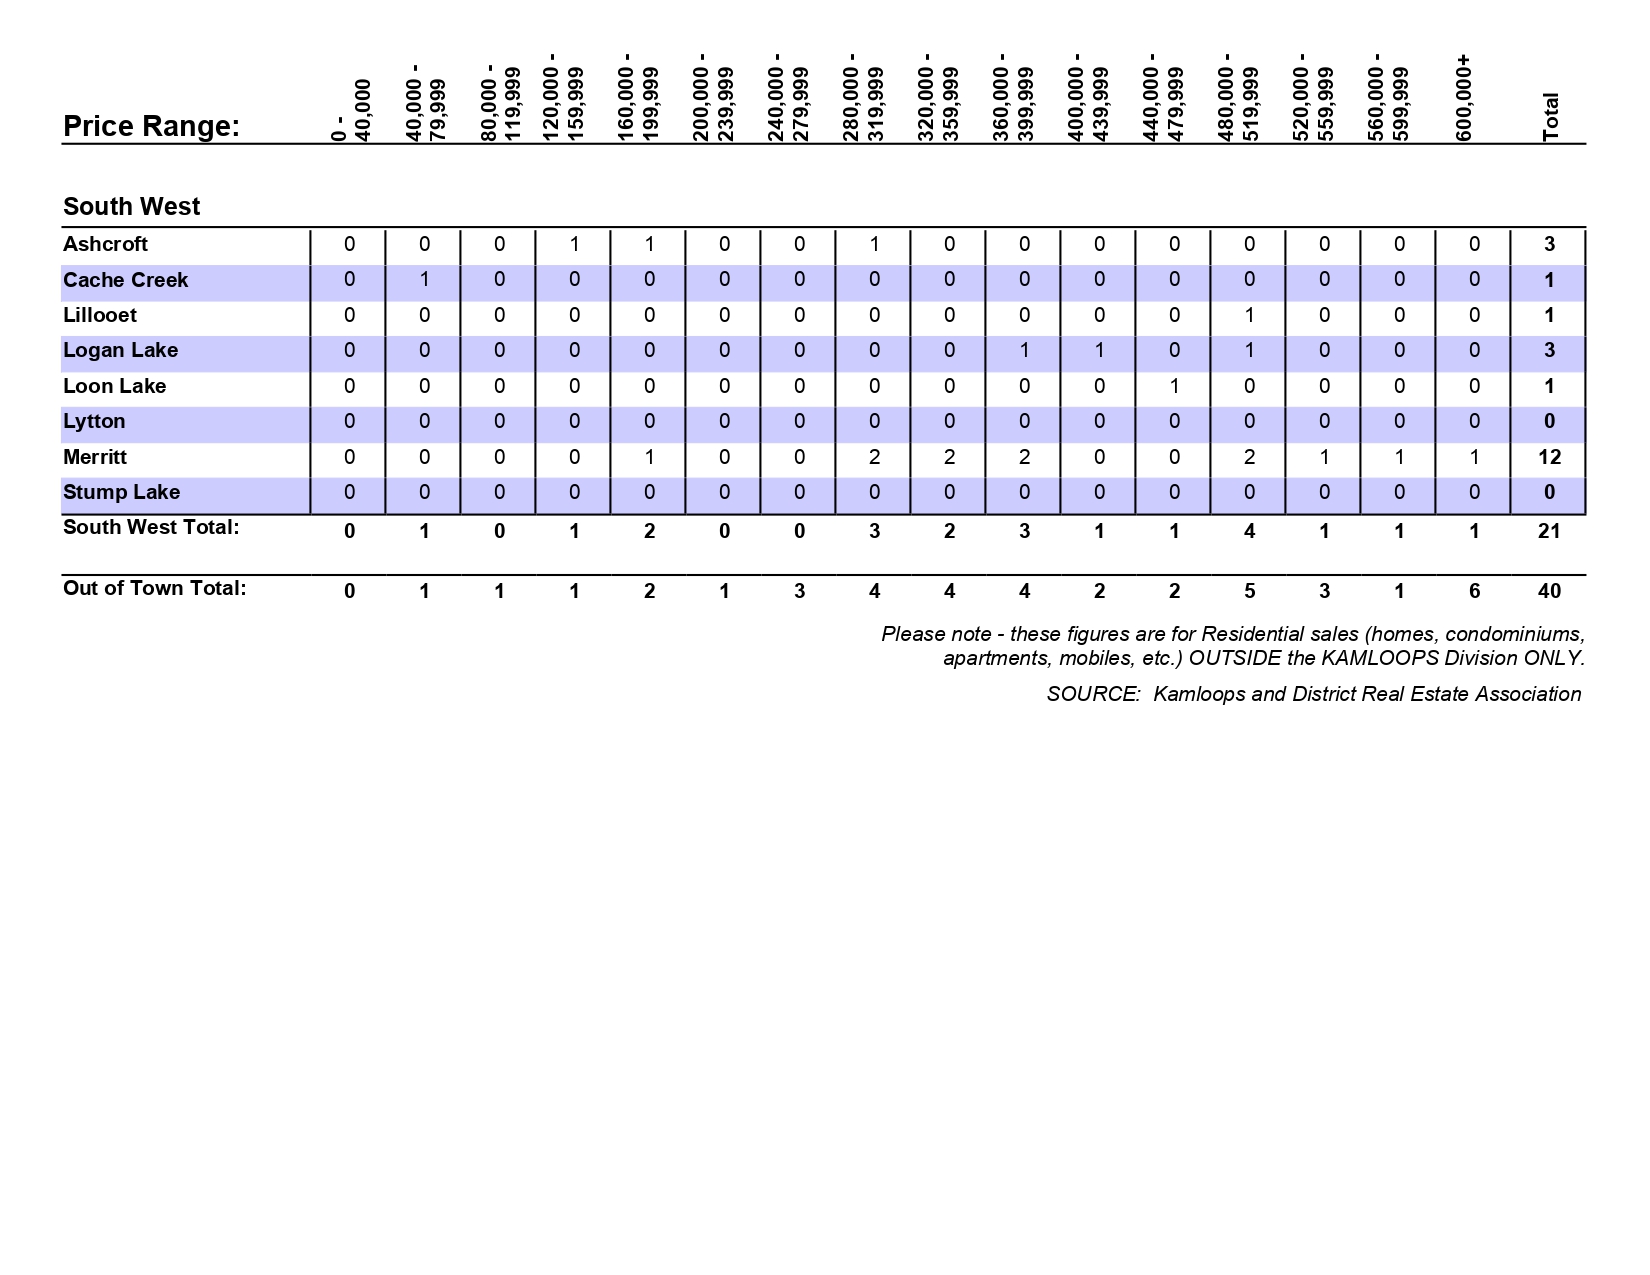
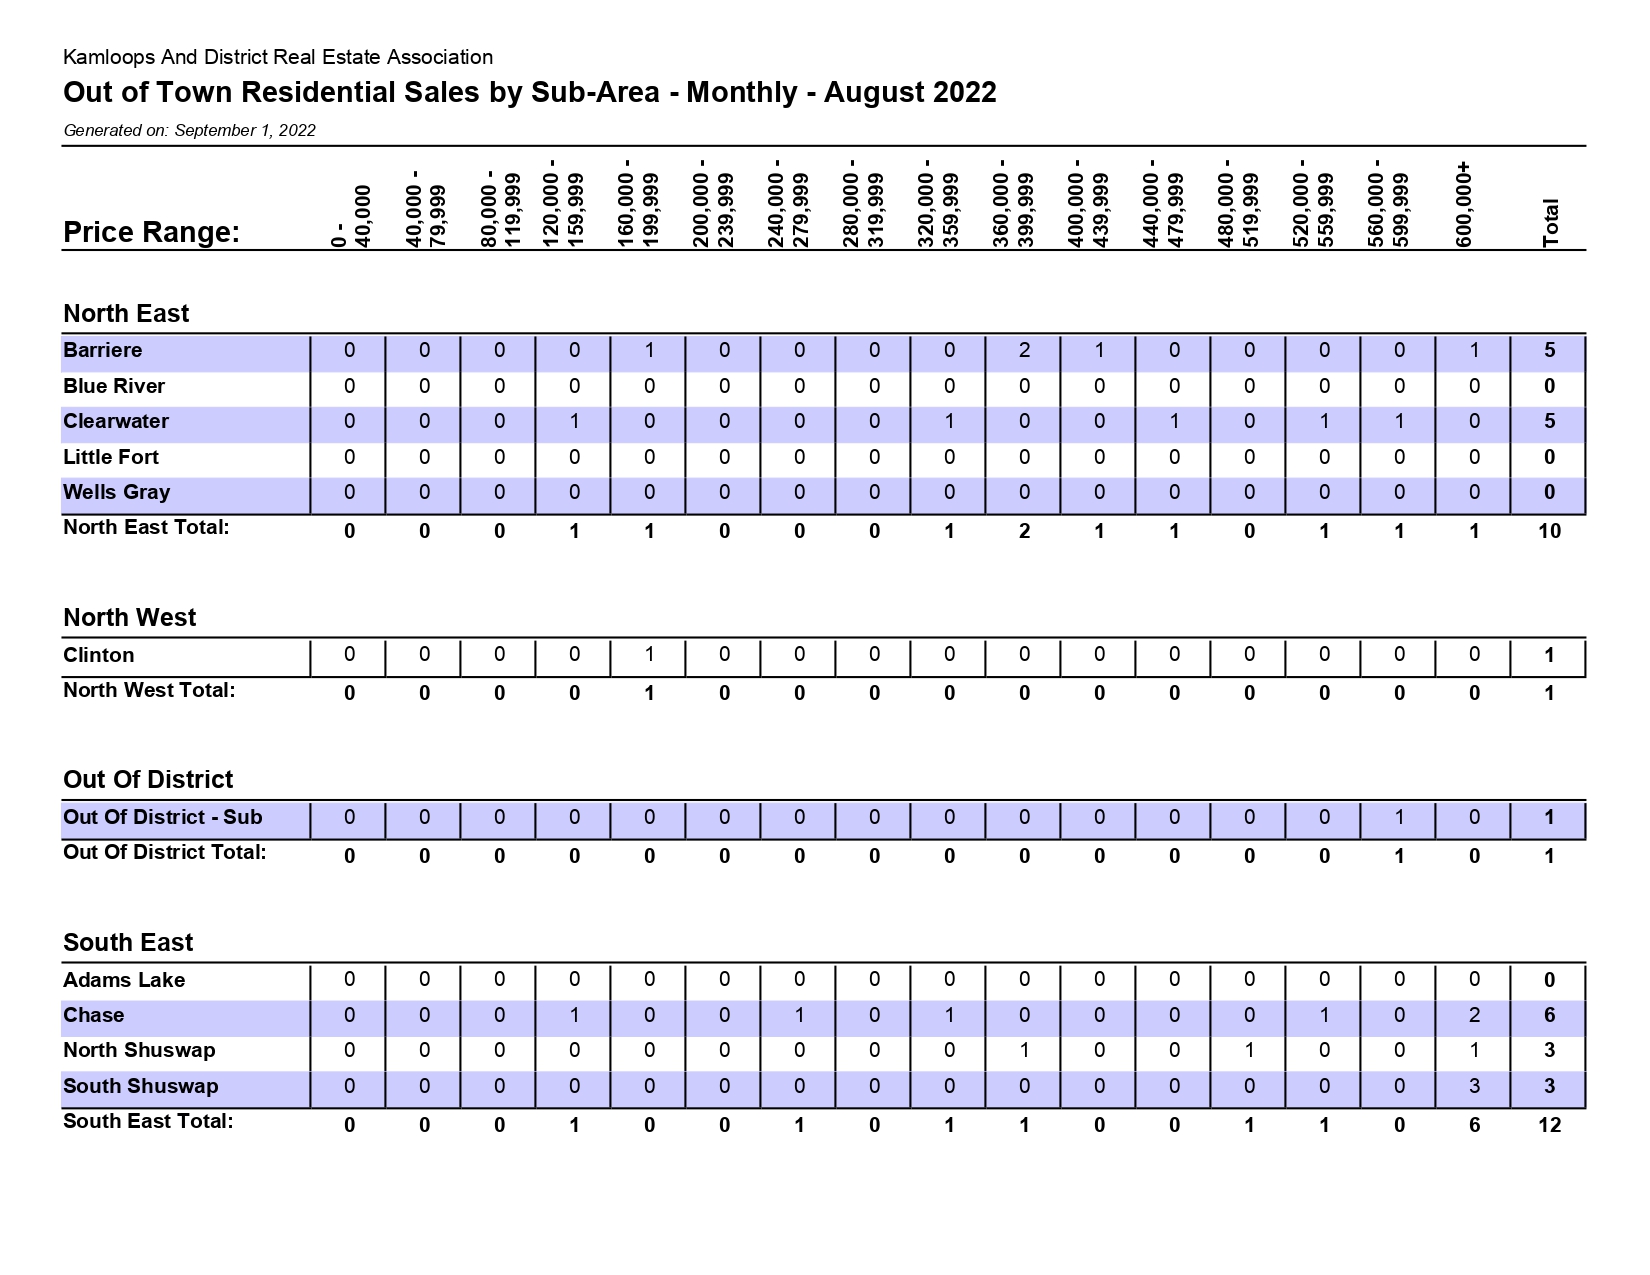
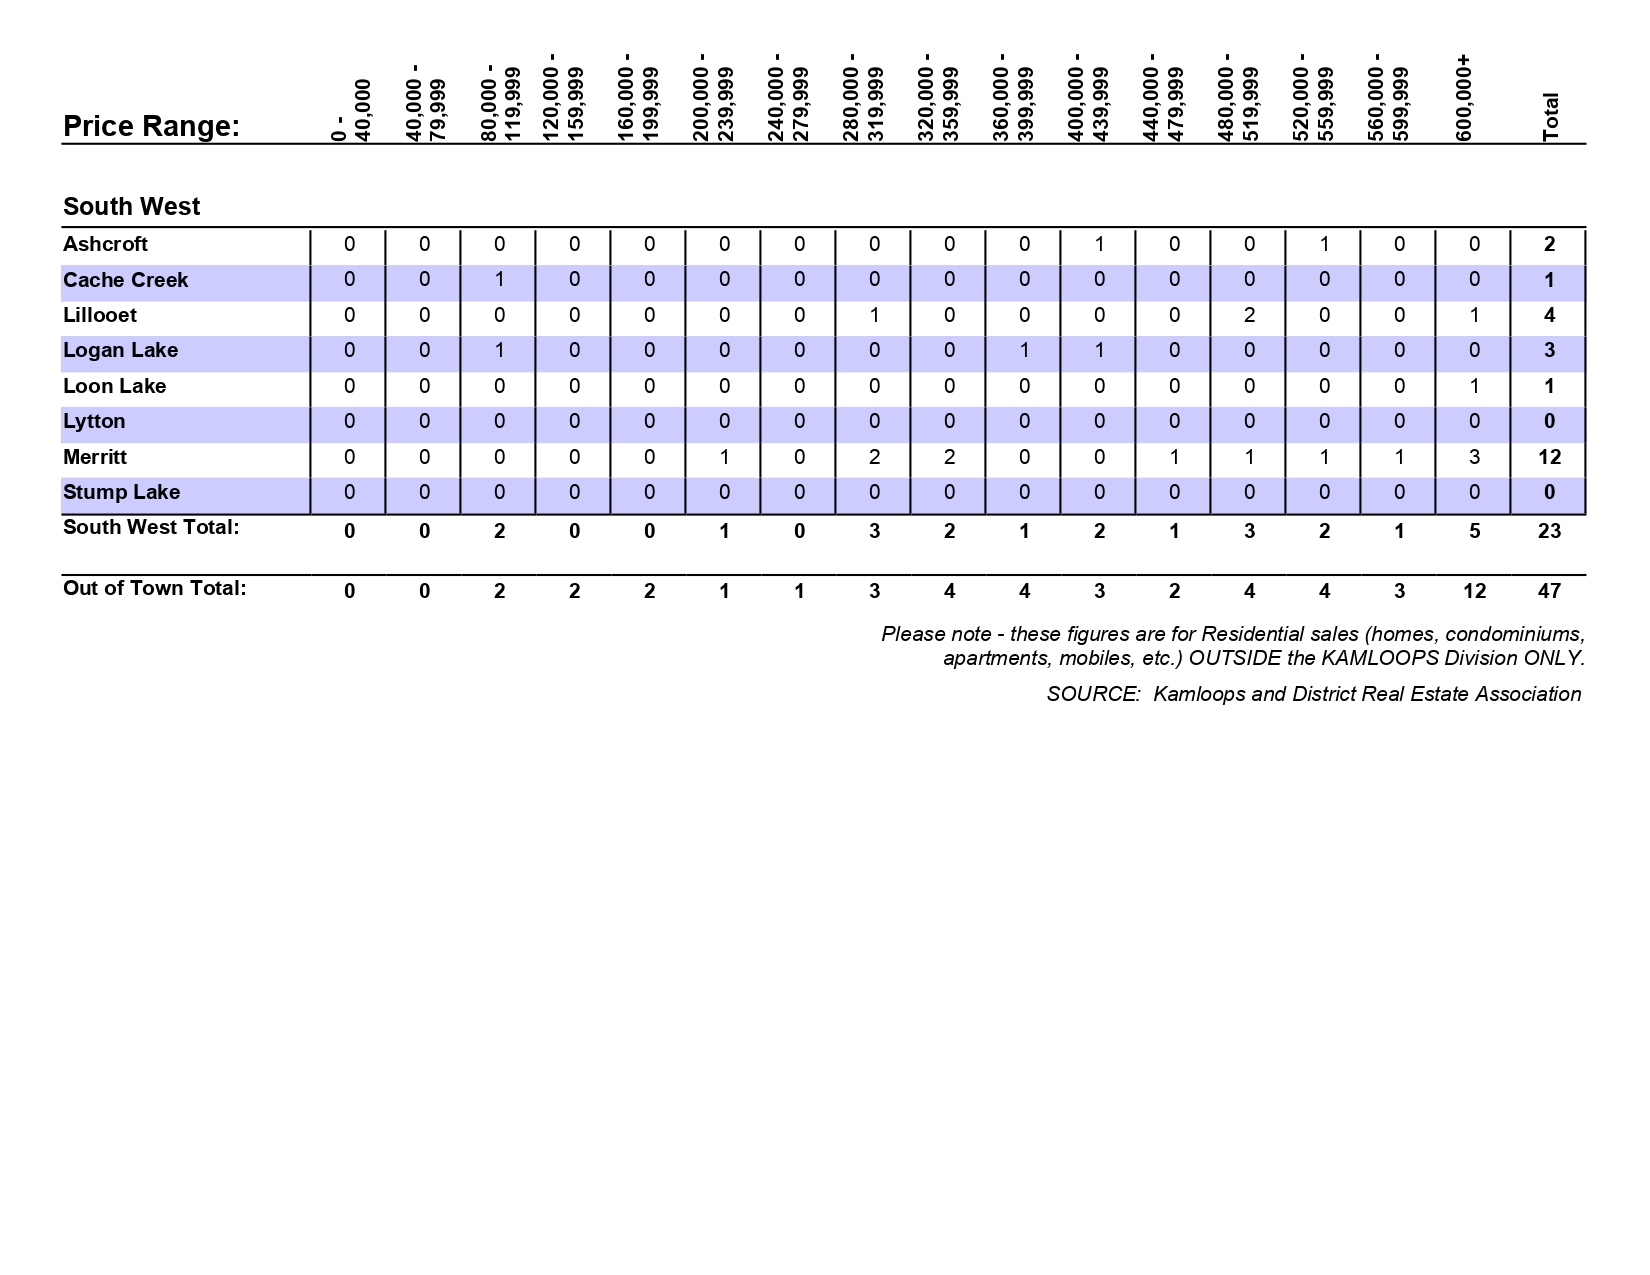
PDF: Residential Sales by Sub-Area (Out of Town) – Sept 2022
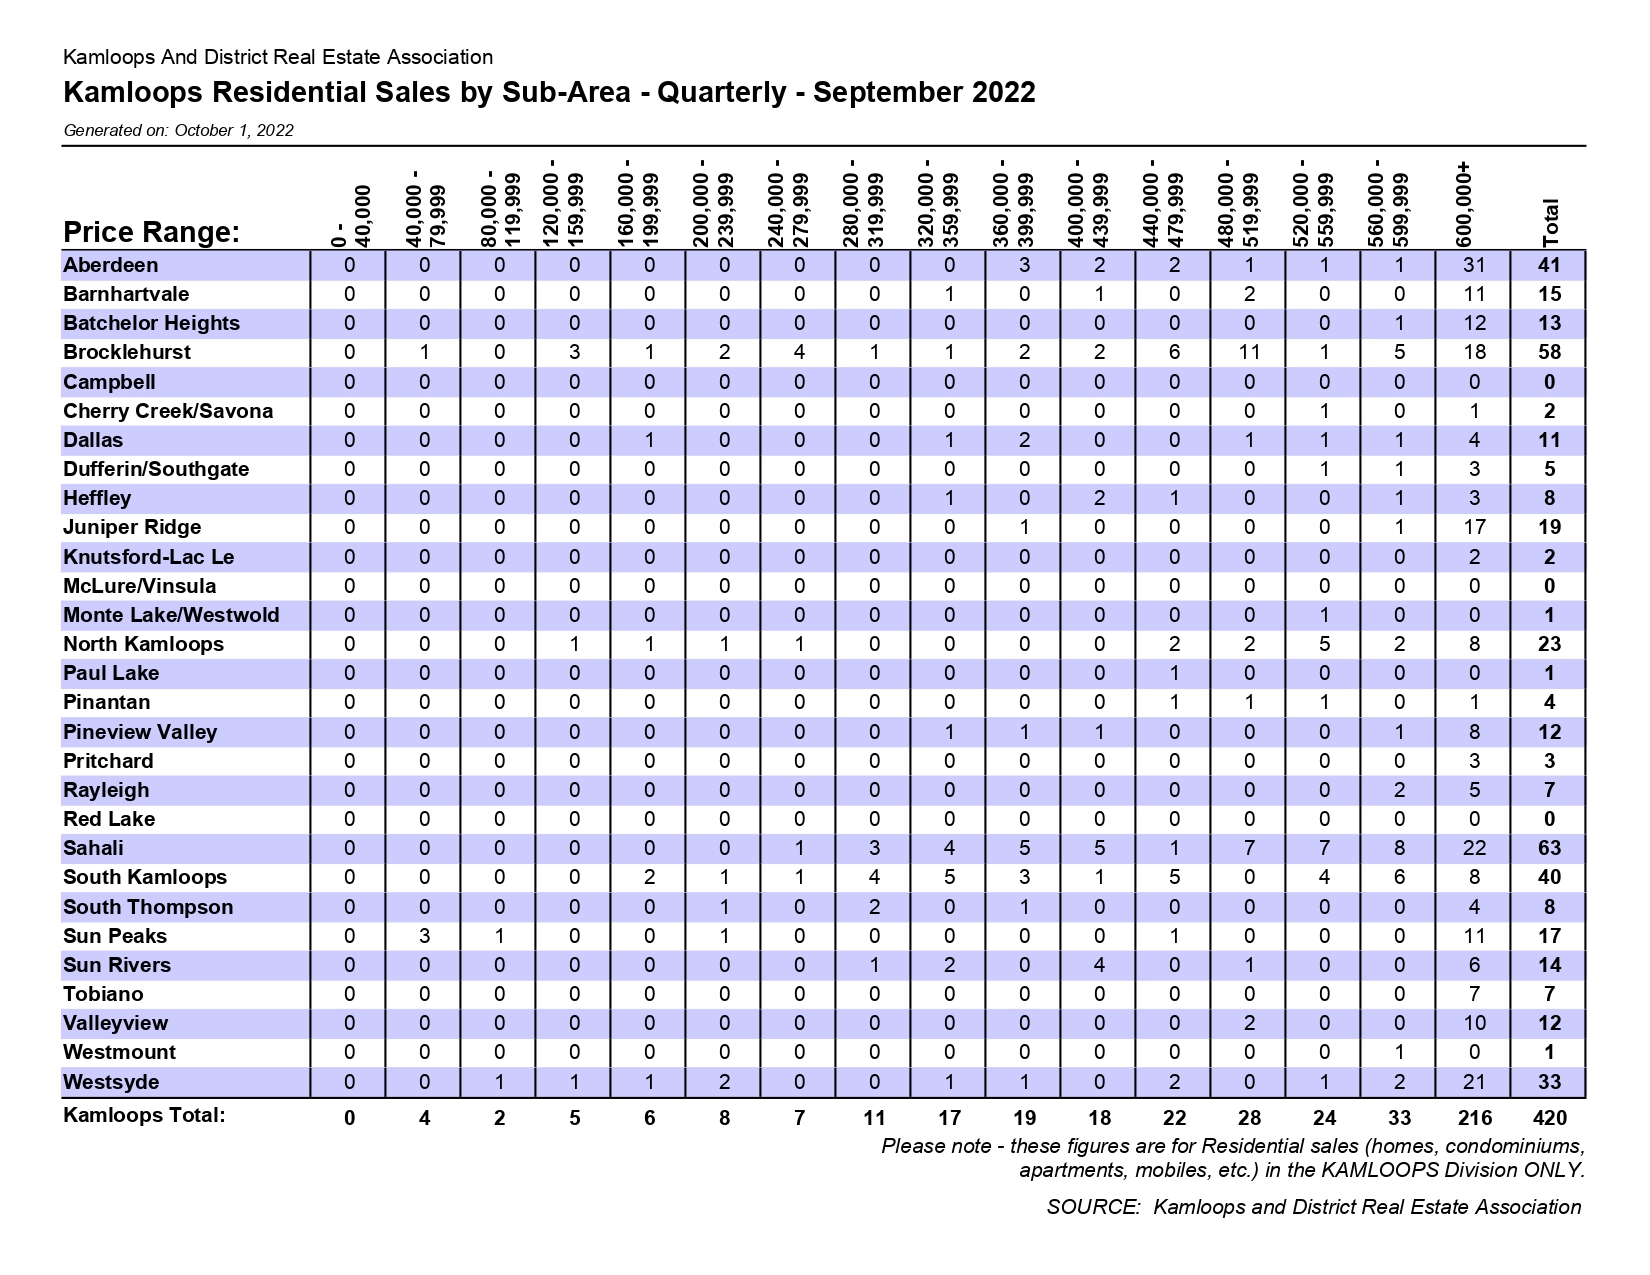
PDF: Residential Sales by Sub-Area – Quarter 3 2022

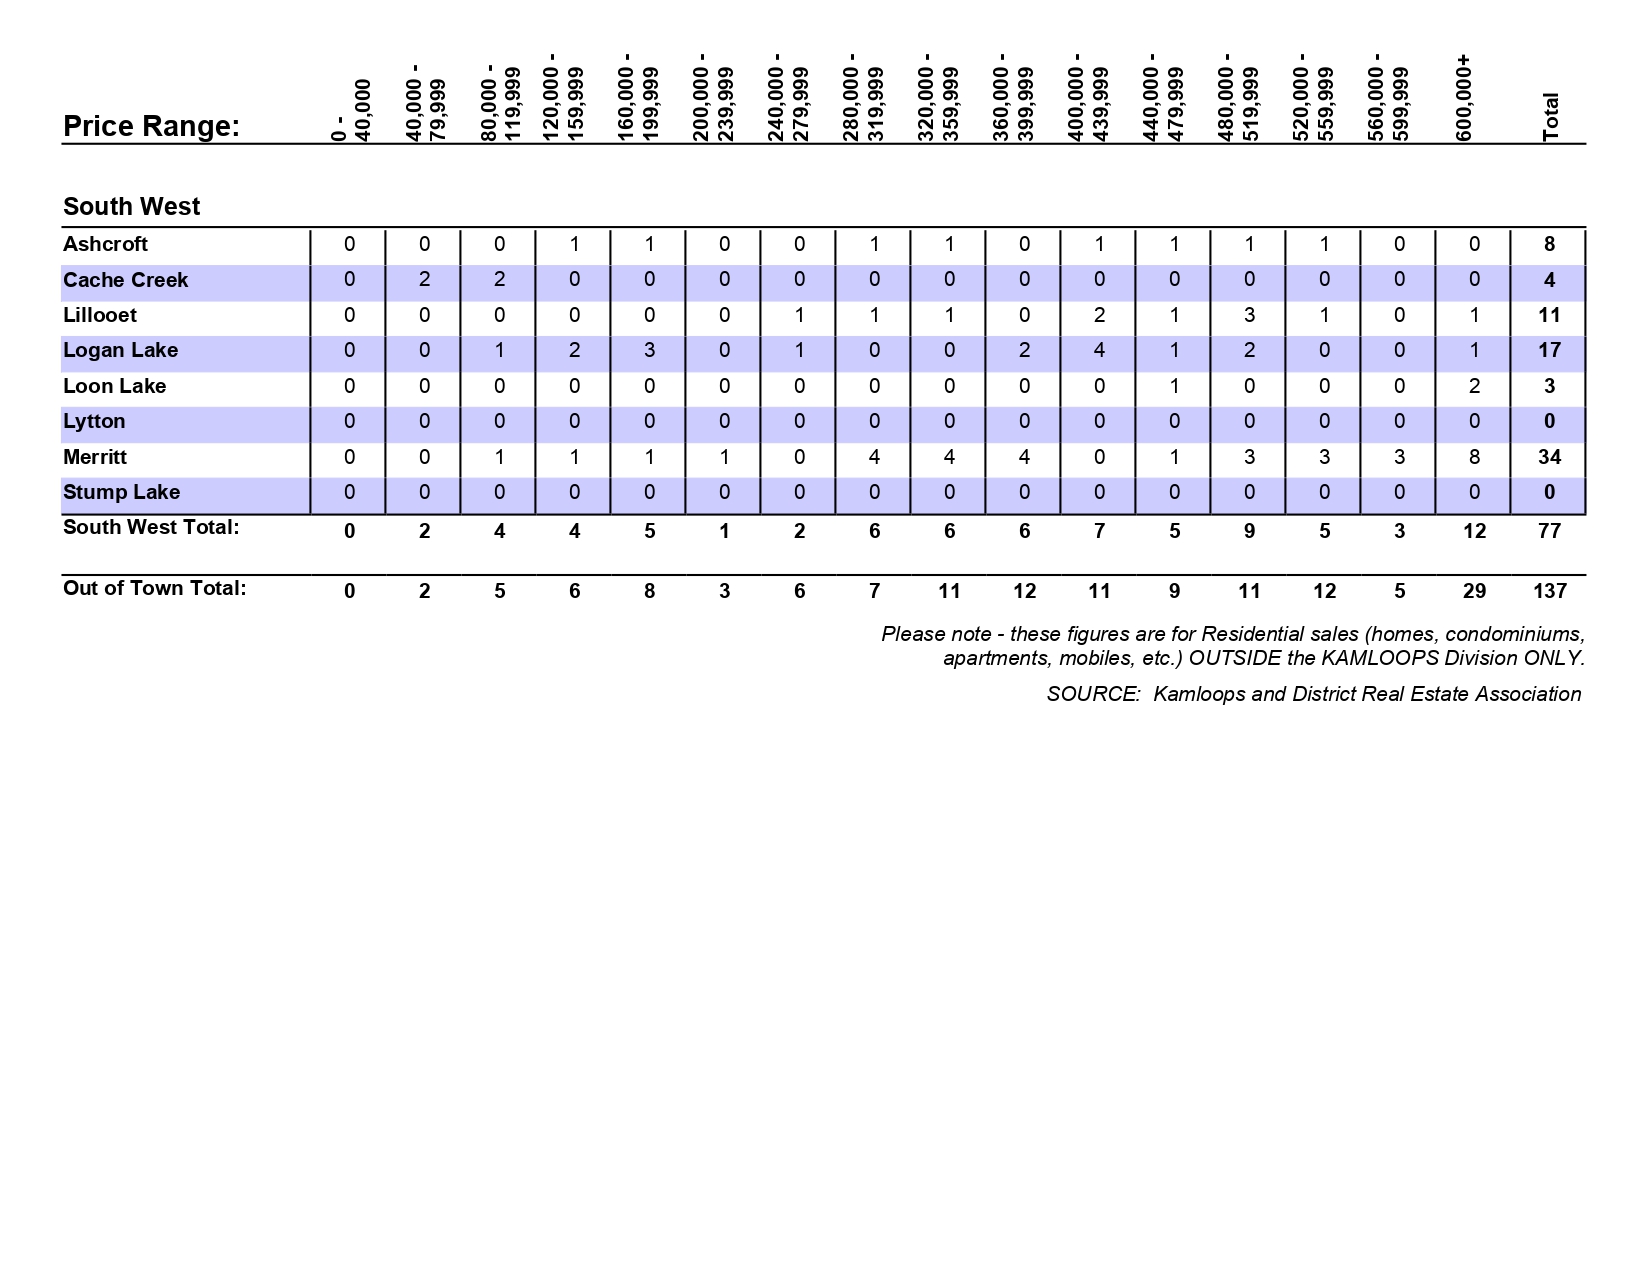
PDF: Residential Sales by Sub-Area (Out of Town) – Quarter 3 2022
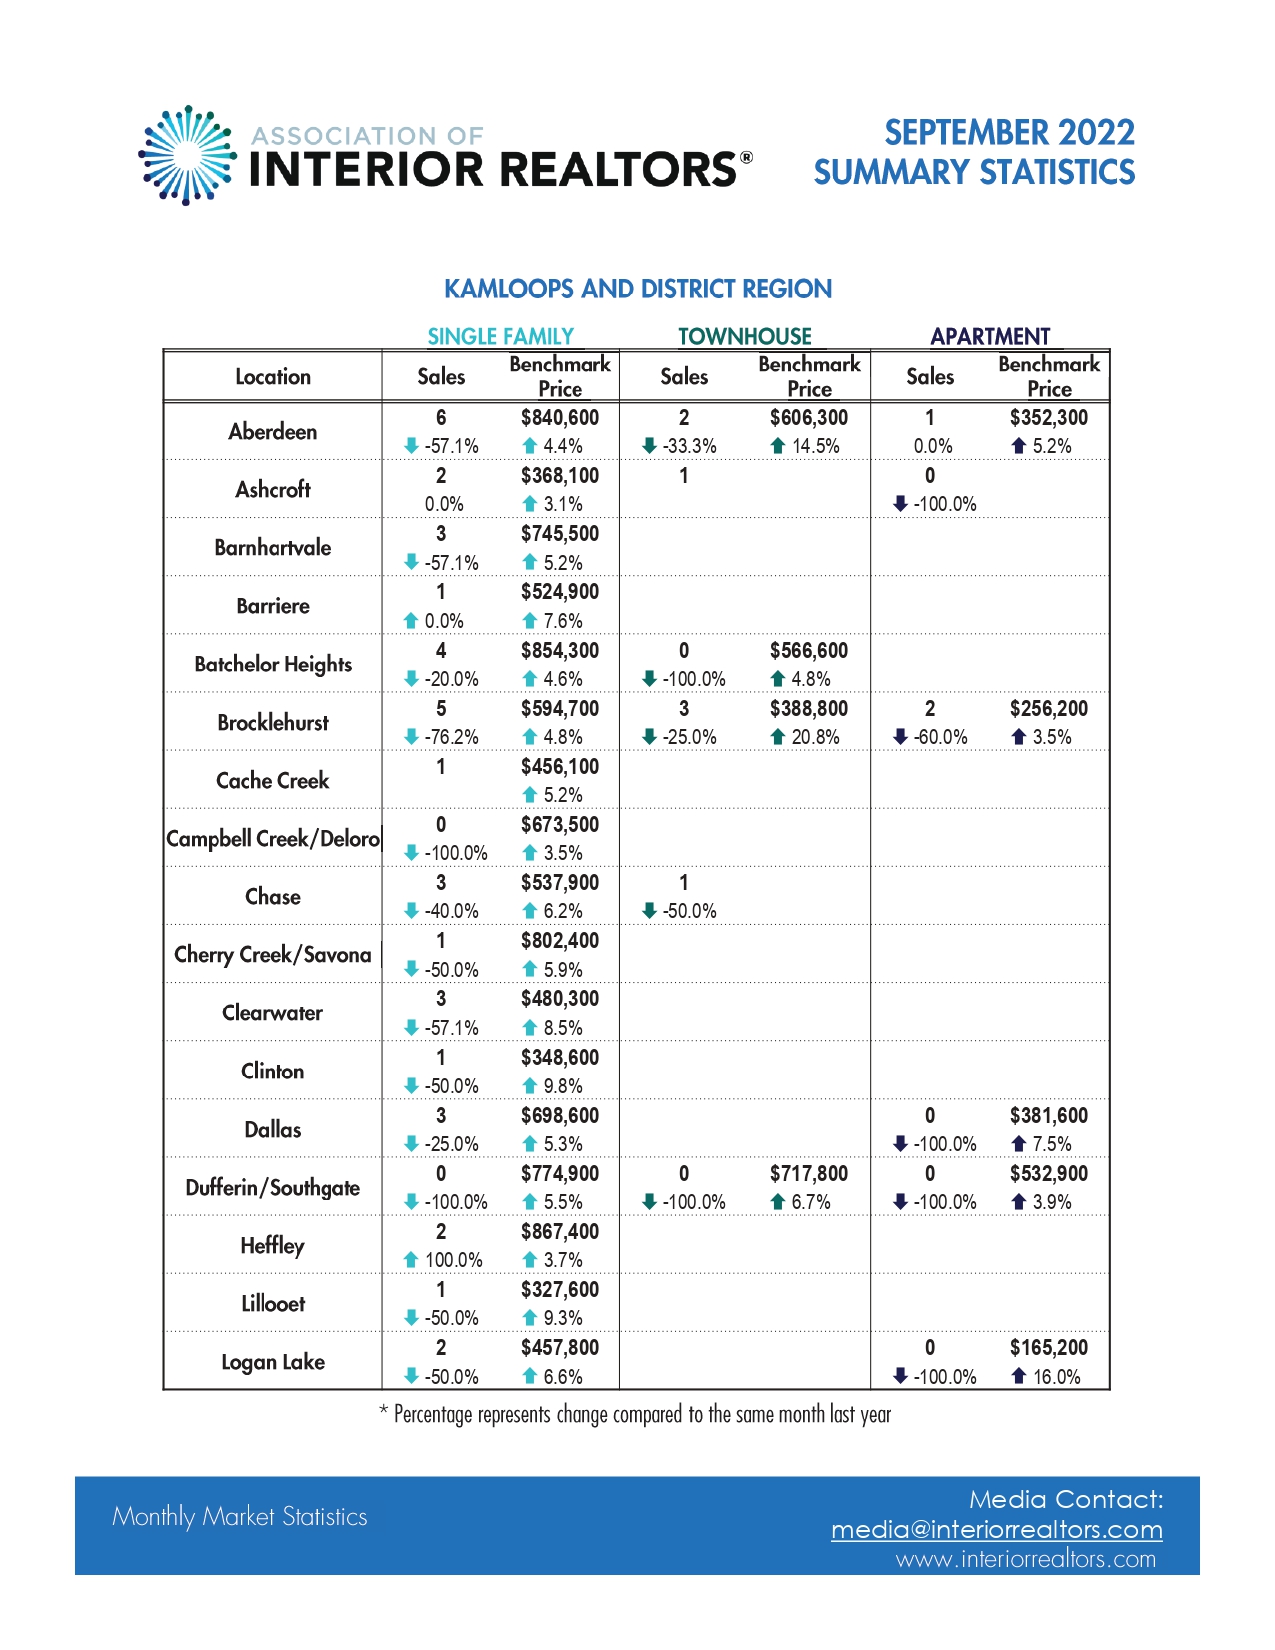
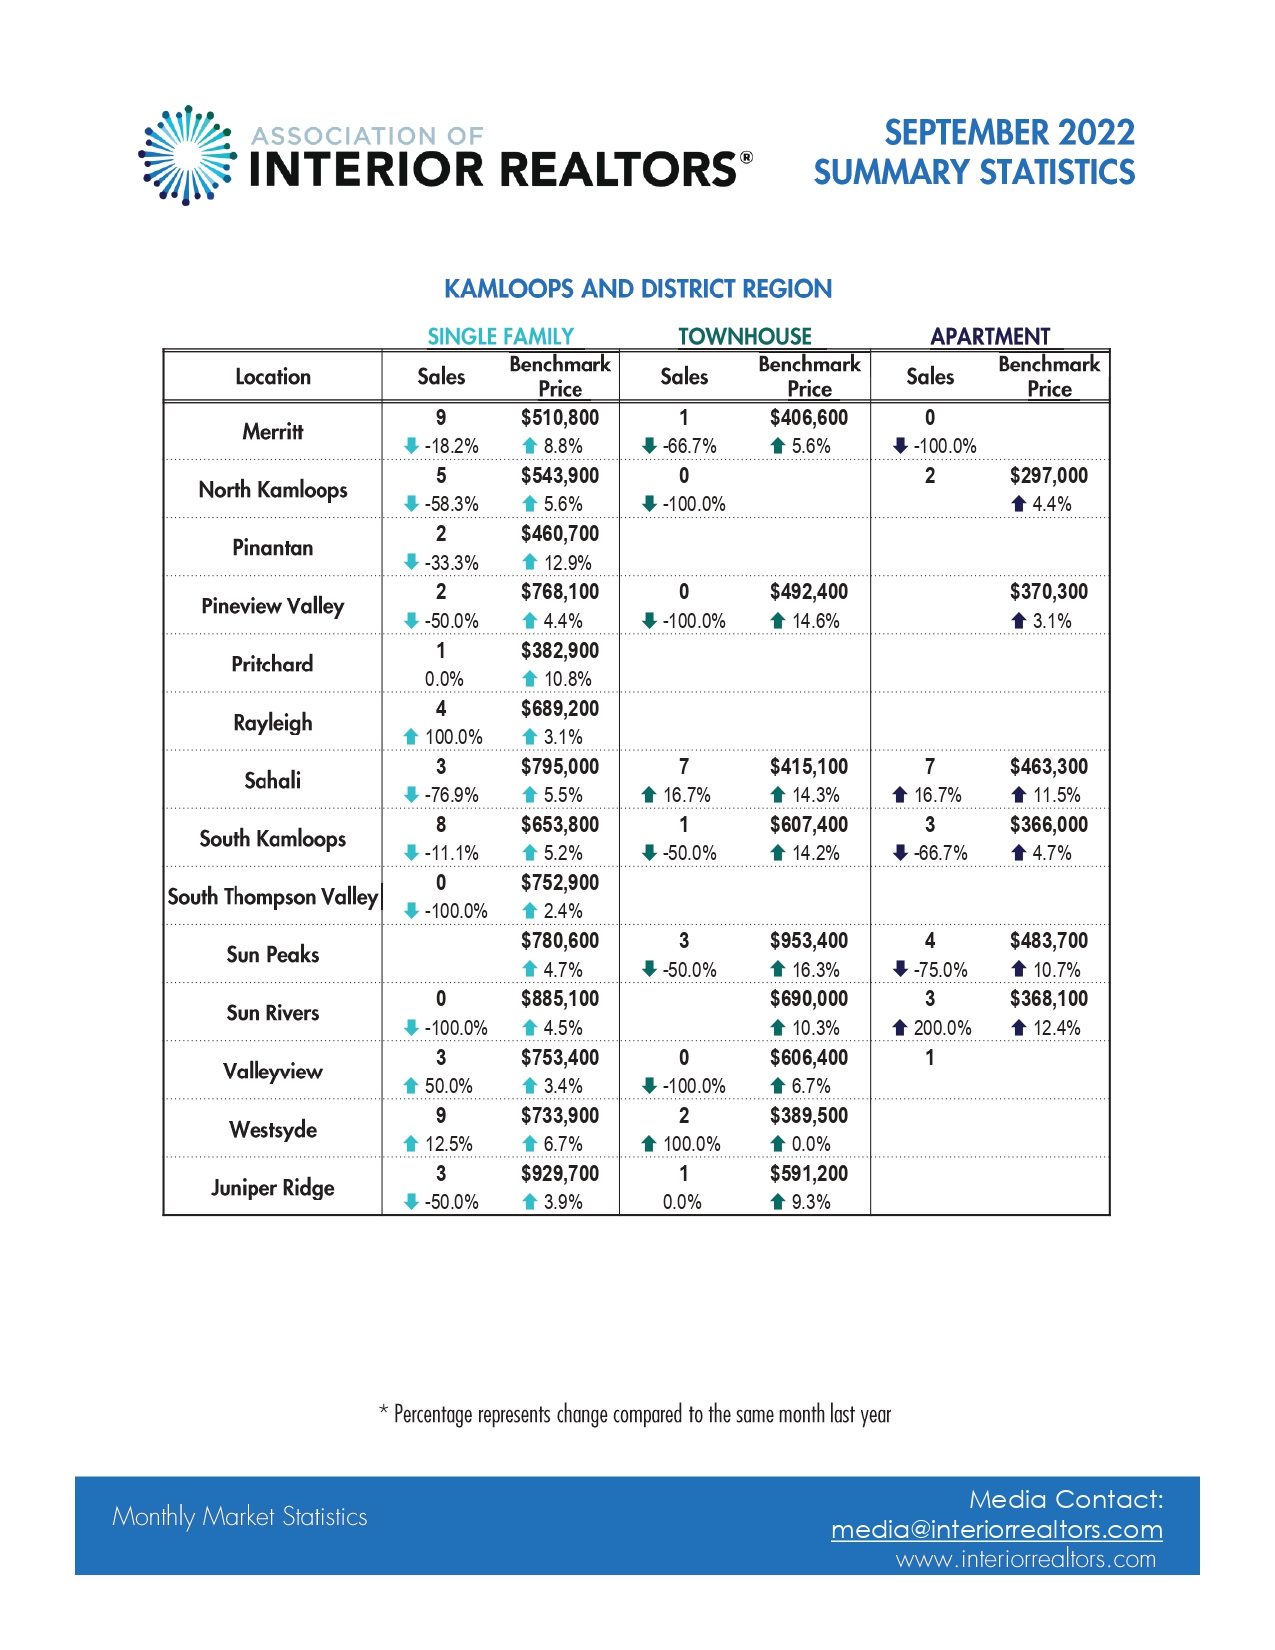
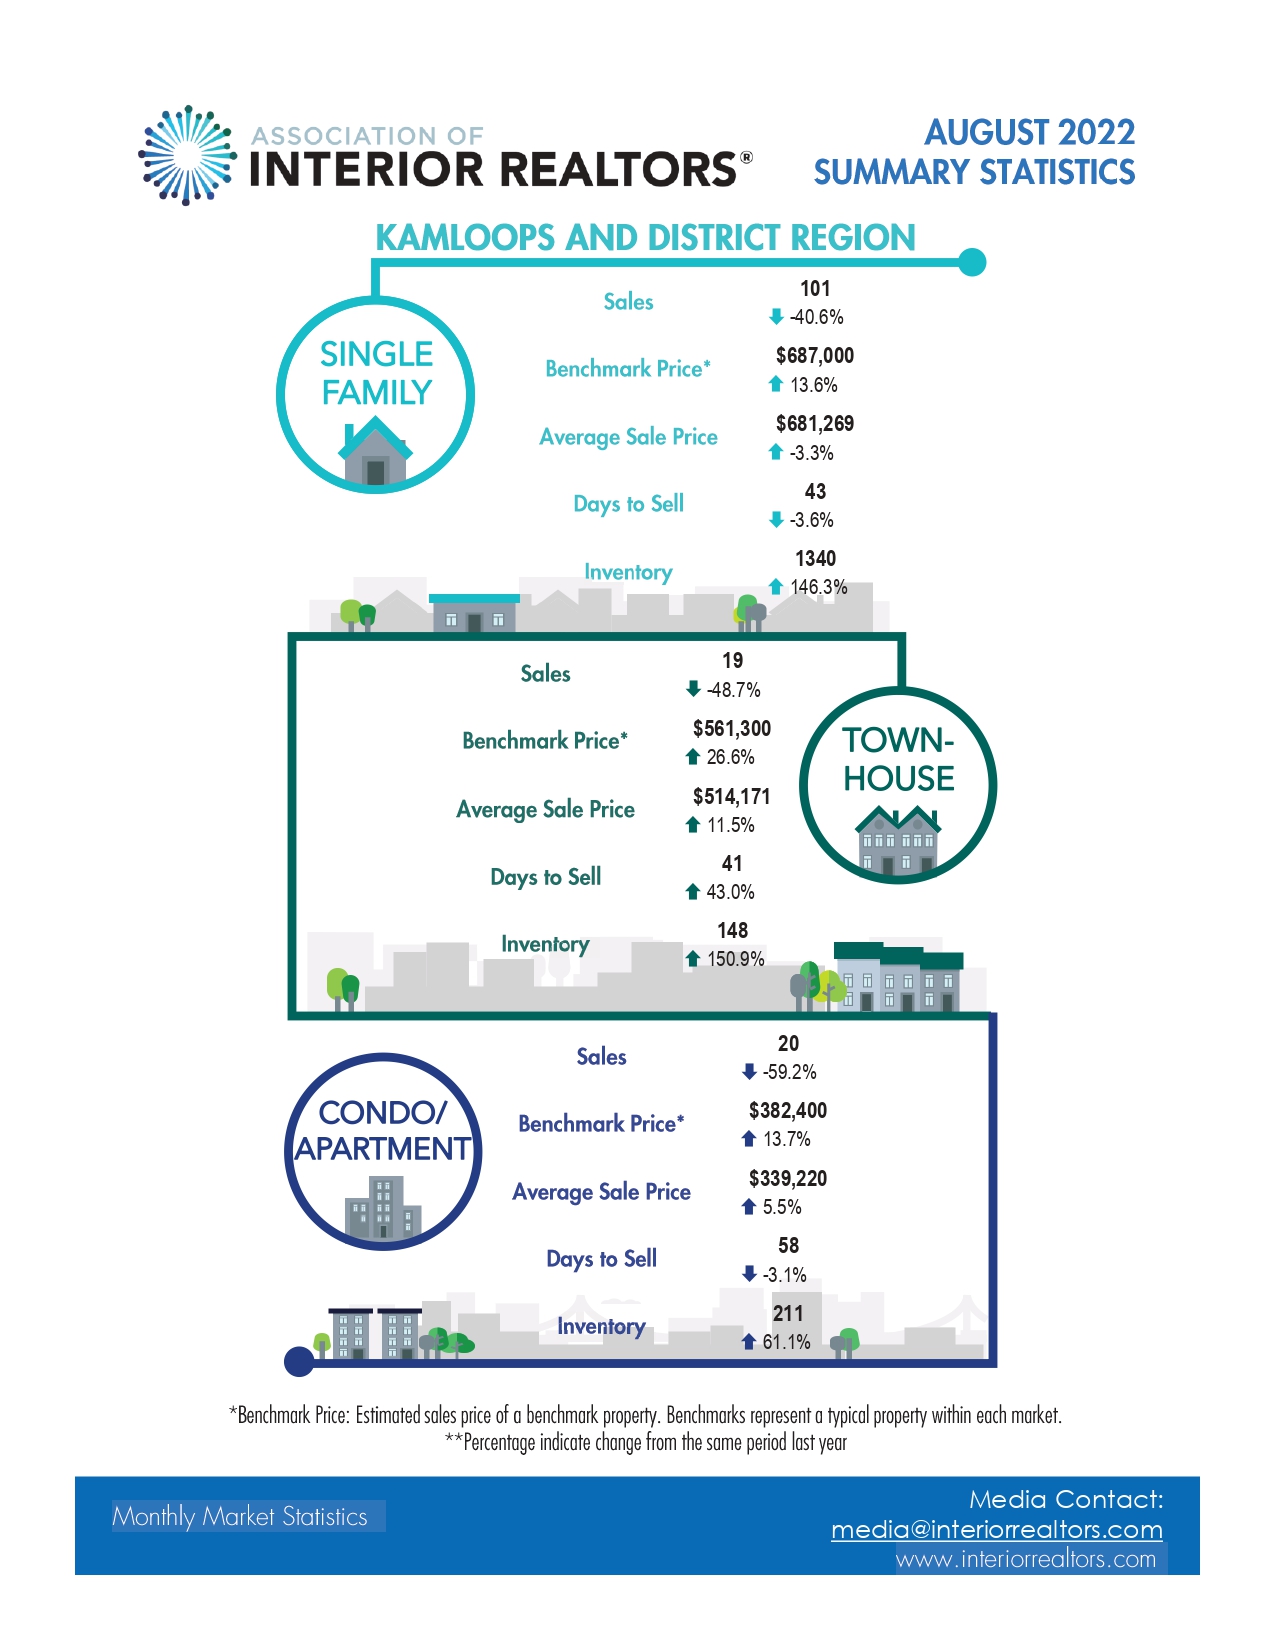
PDF: Statistics Summary – Sept 2022
For Previous Monthly, Quarterly & Annual Statistics click here.
To View our current listings click here.