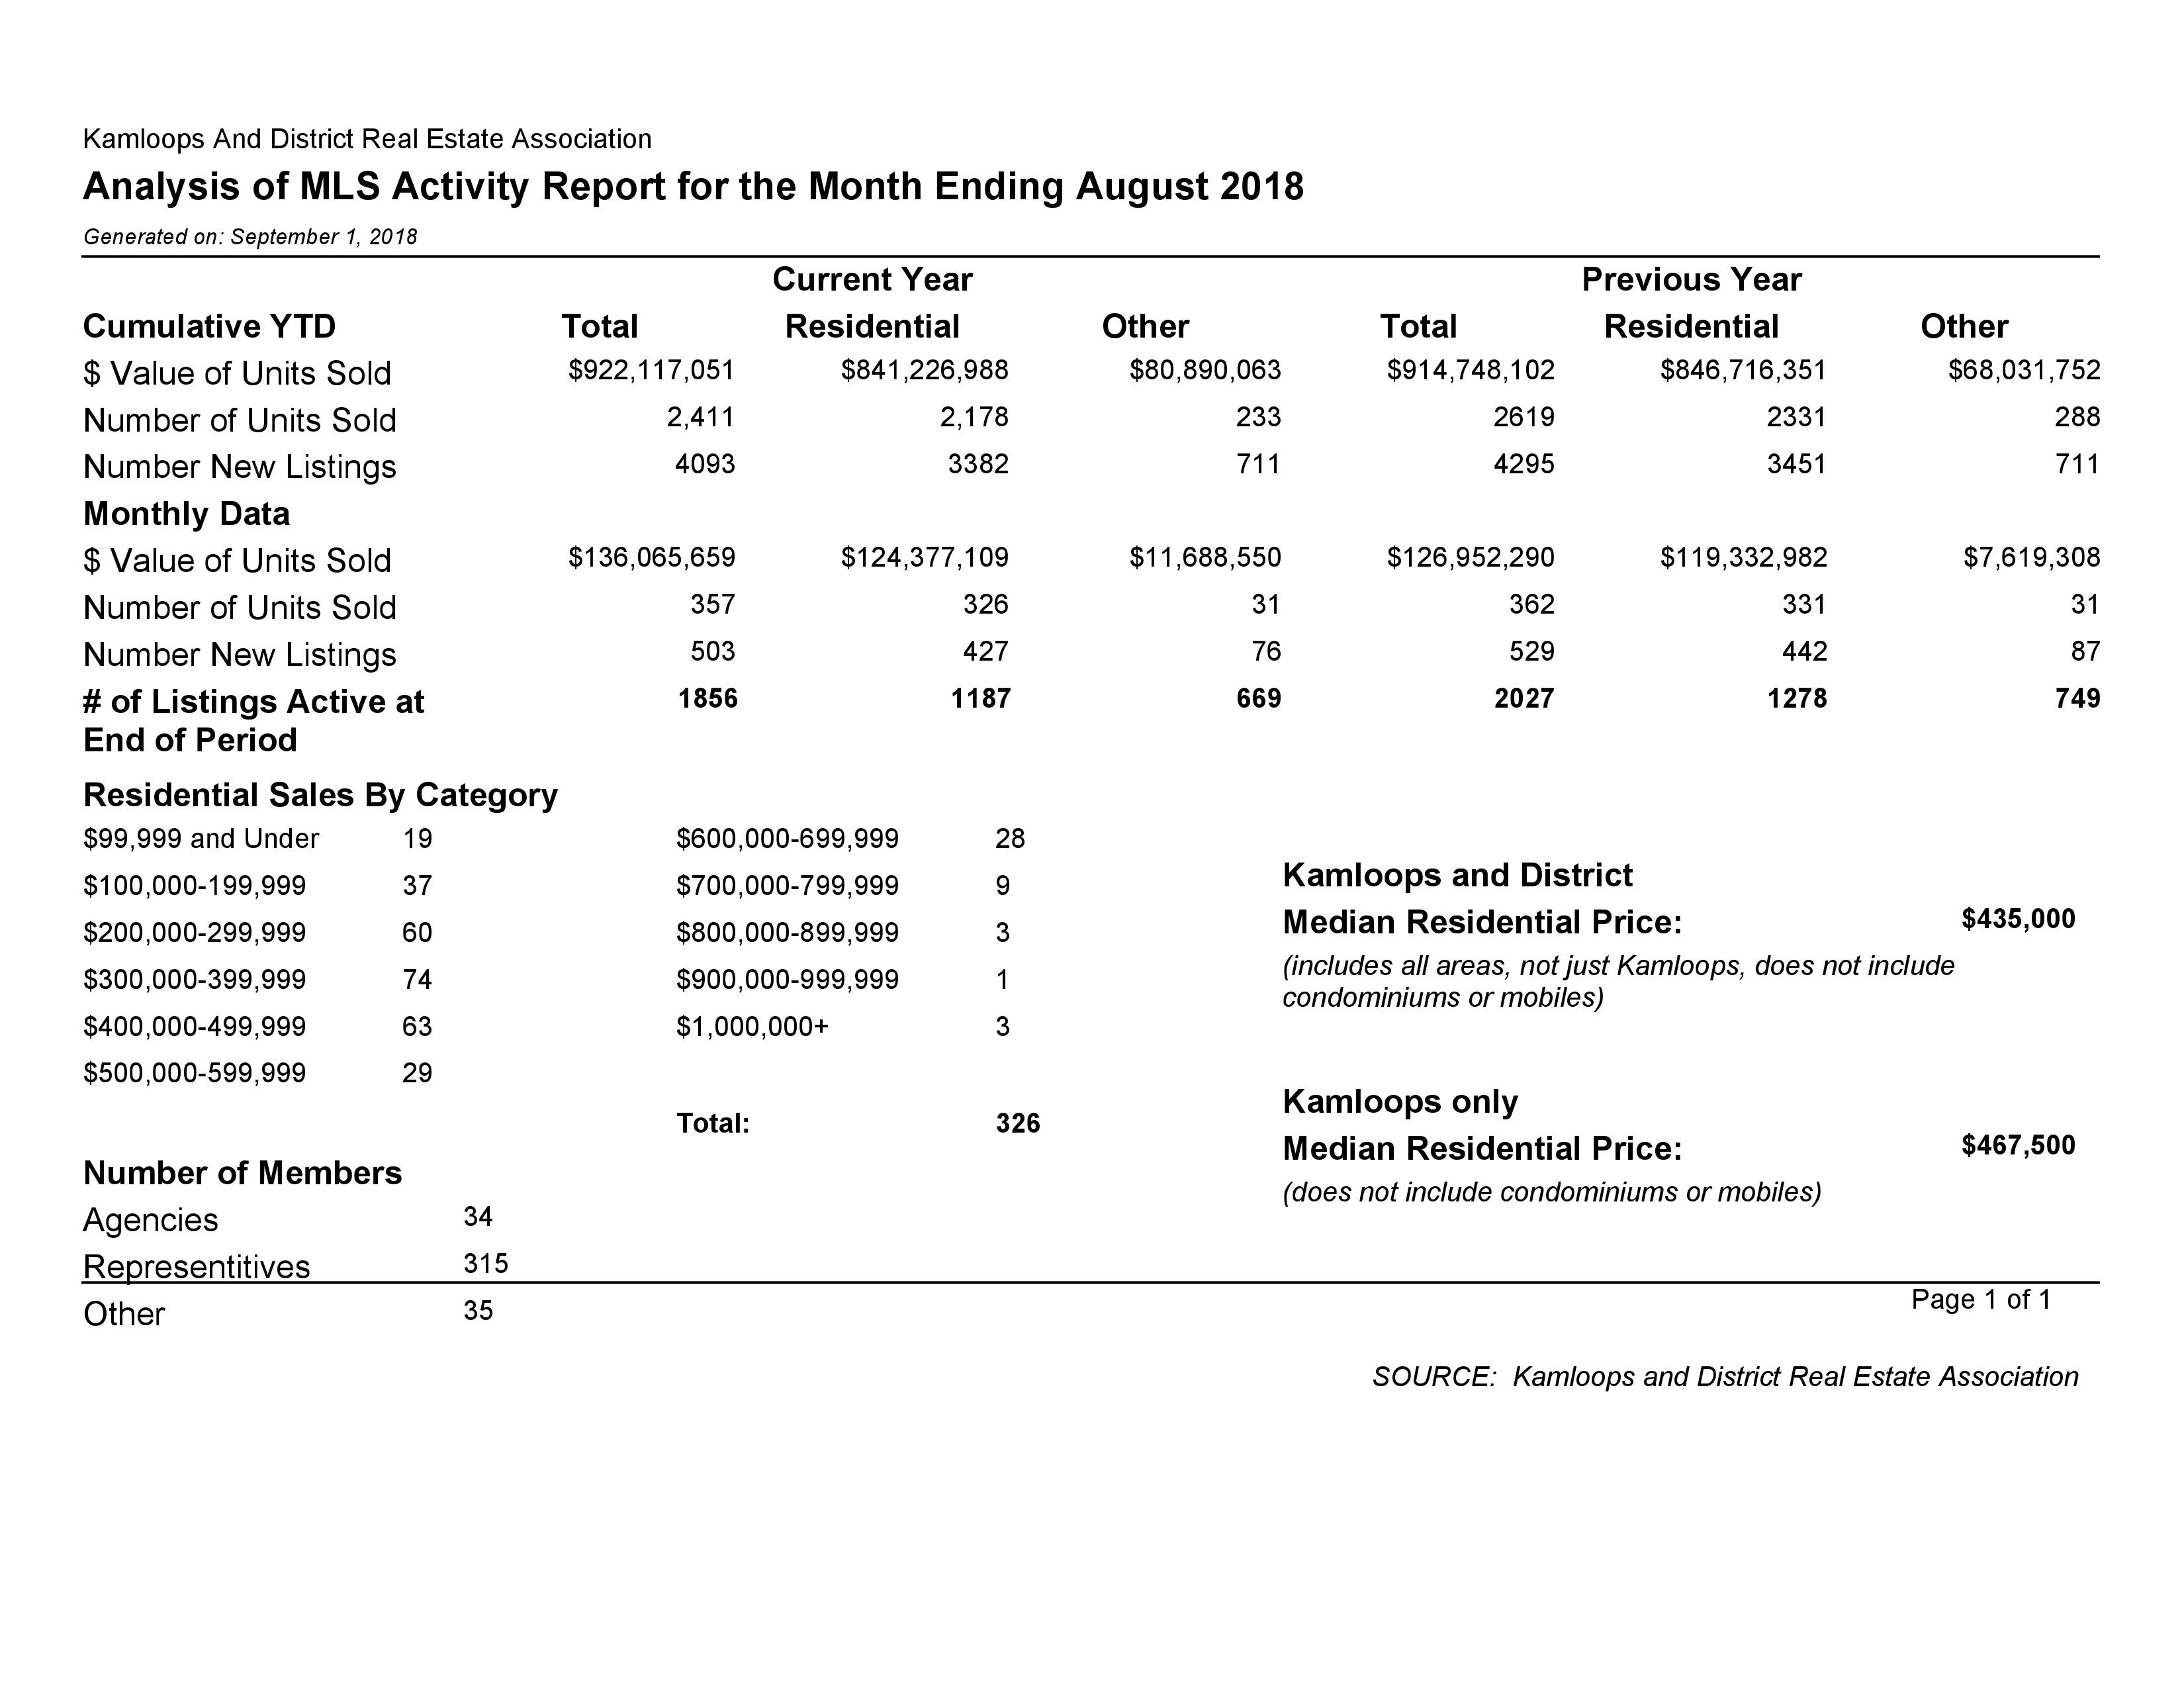
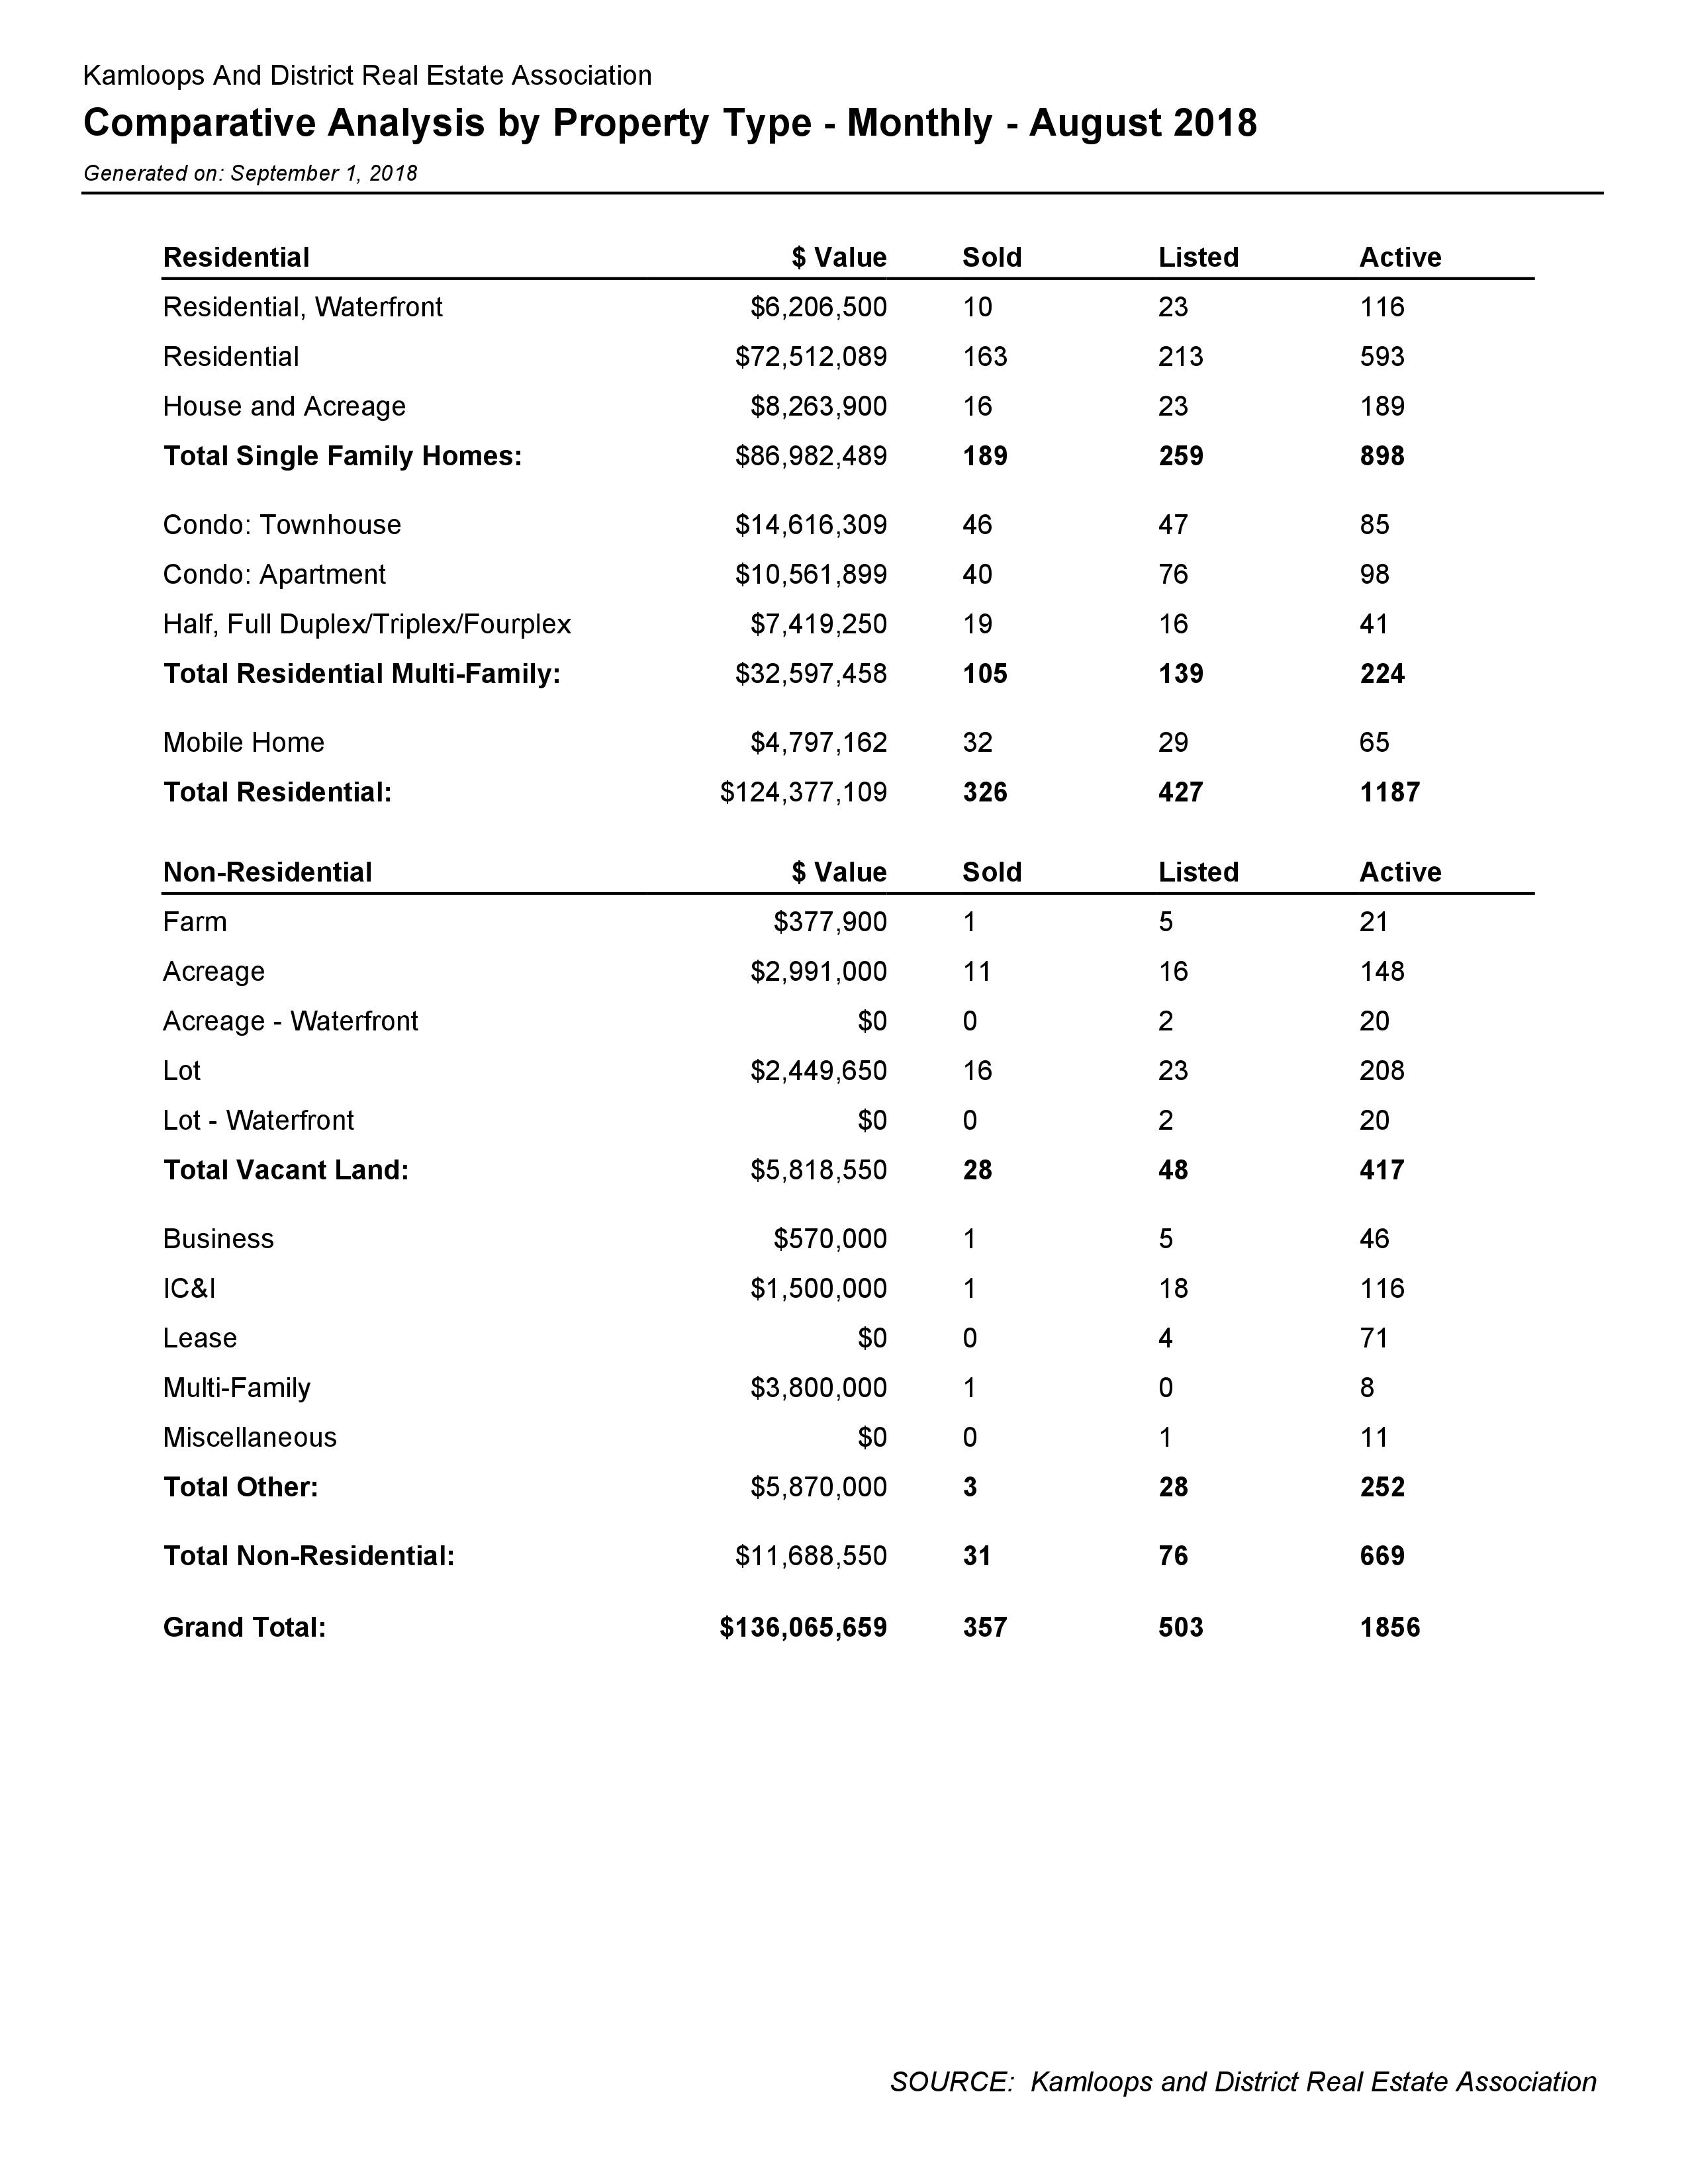
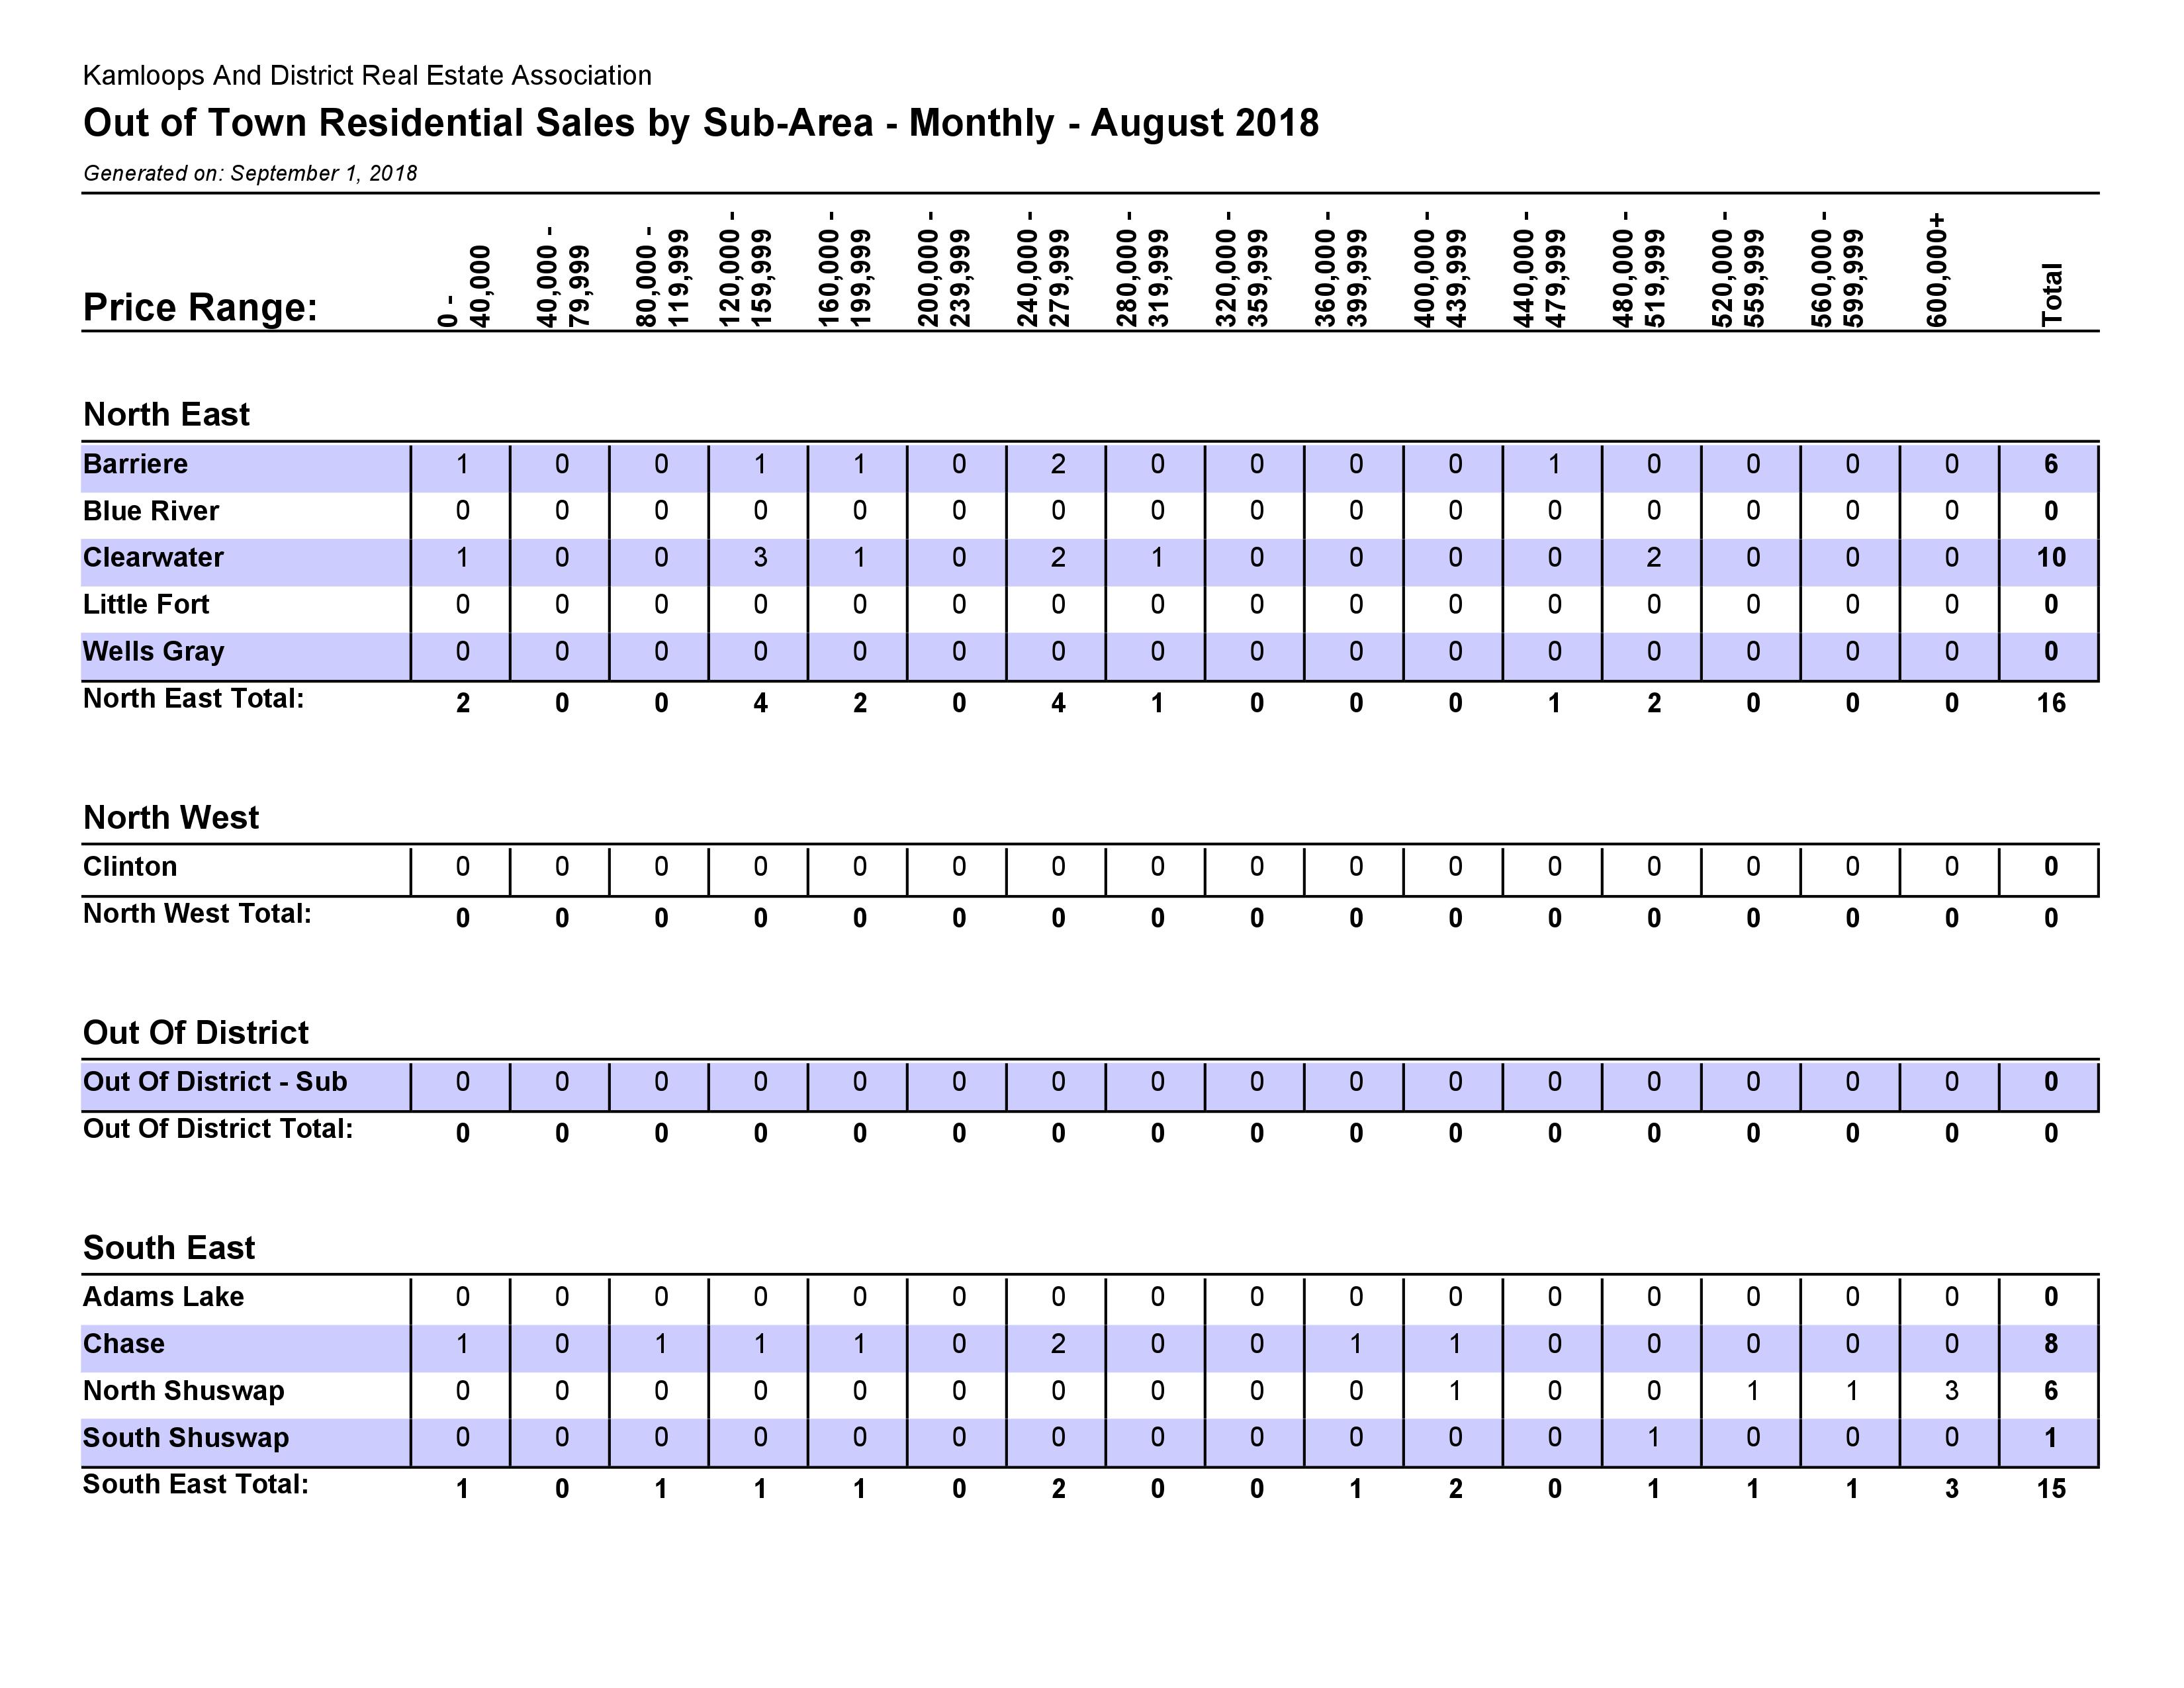
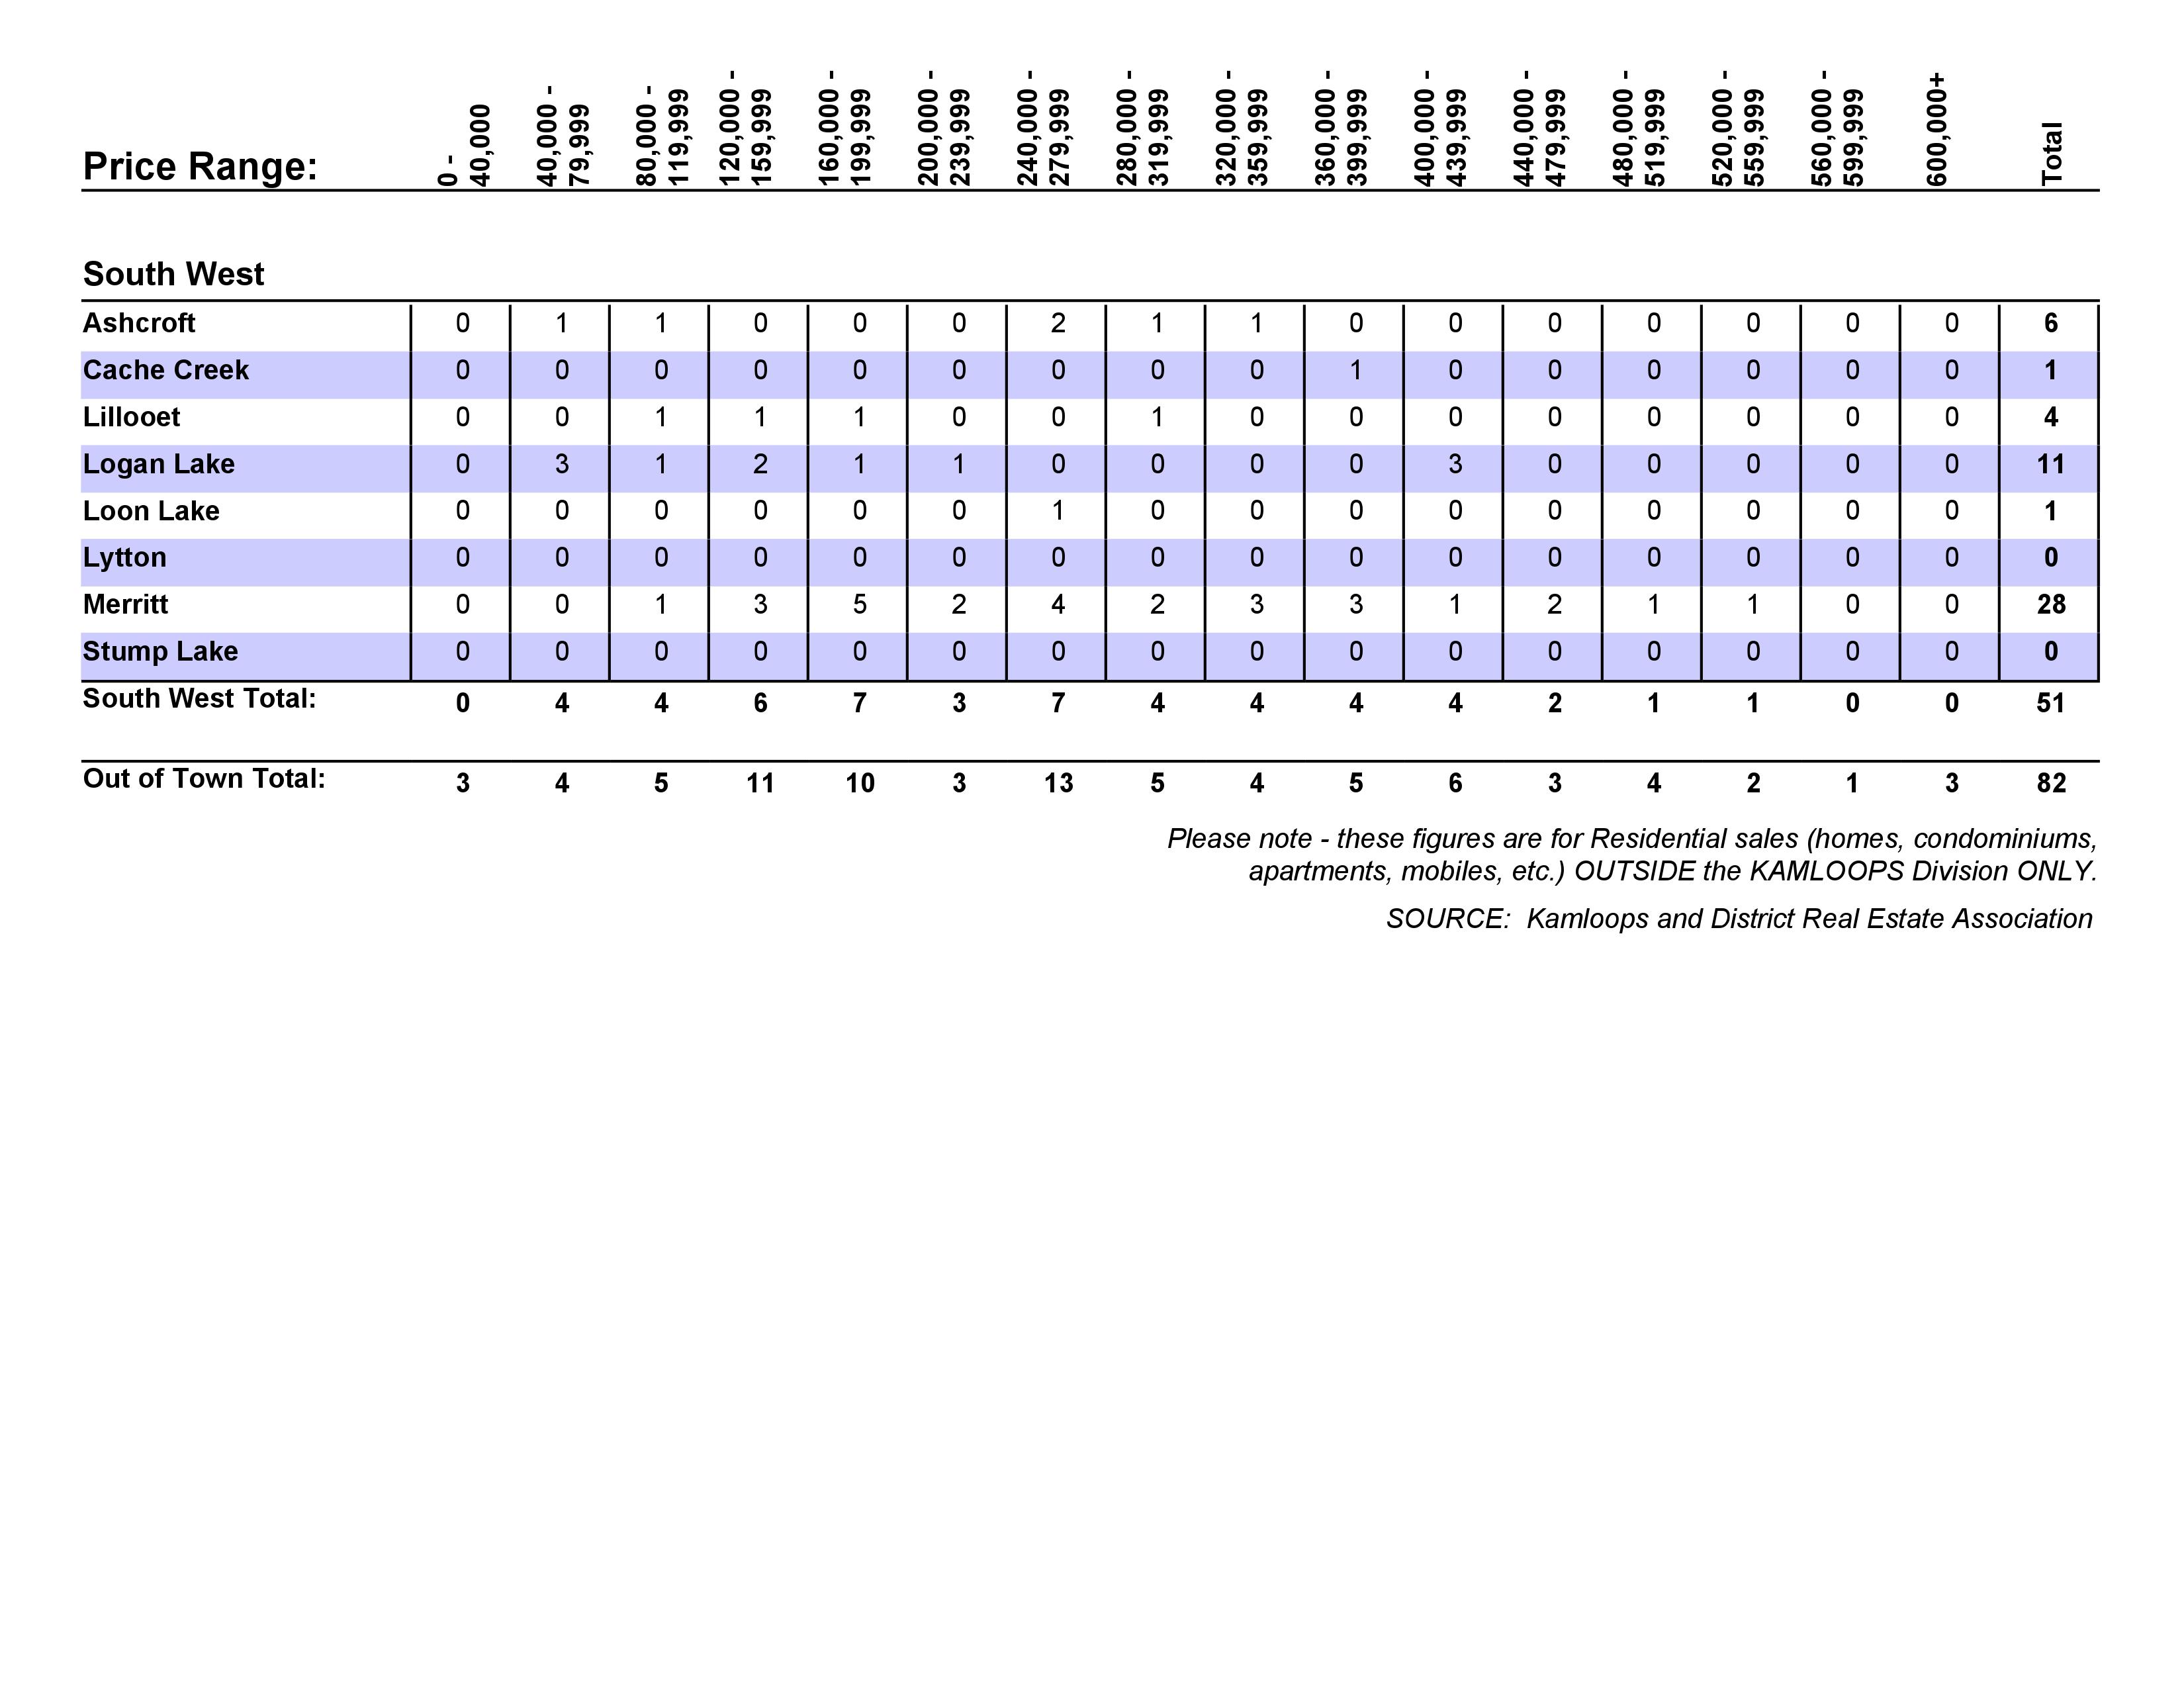
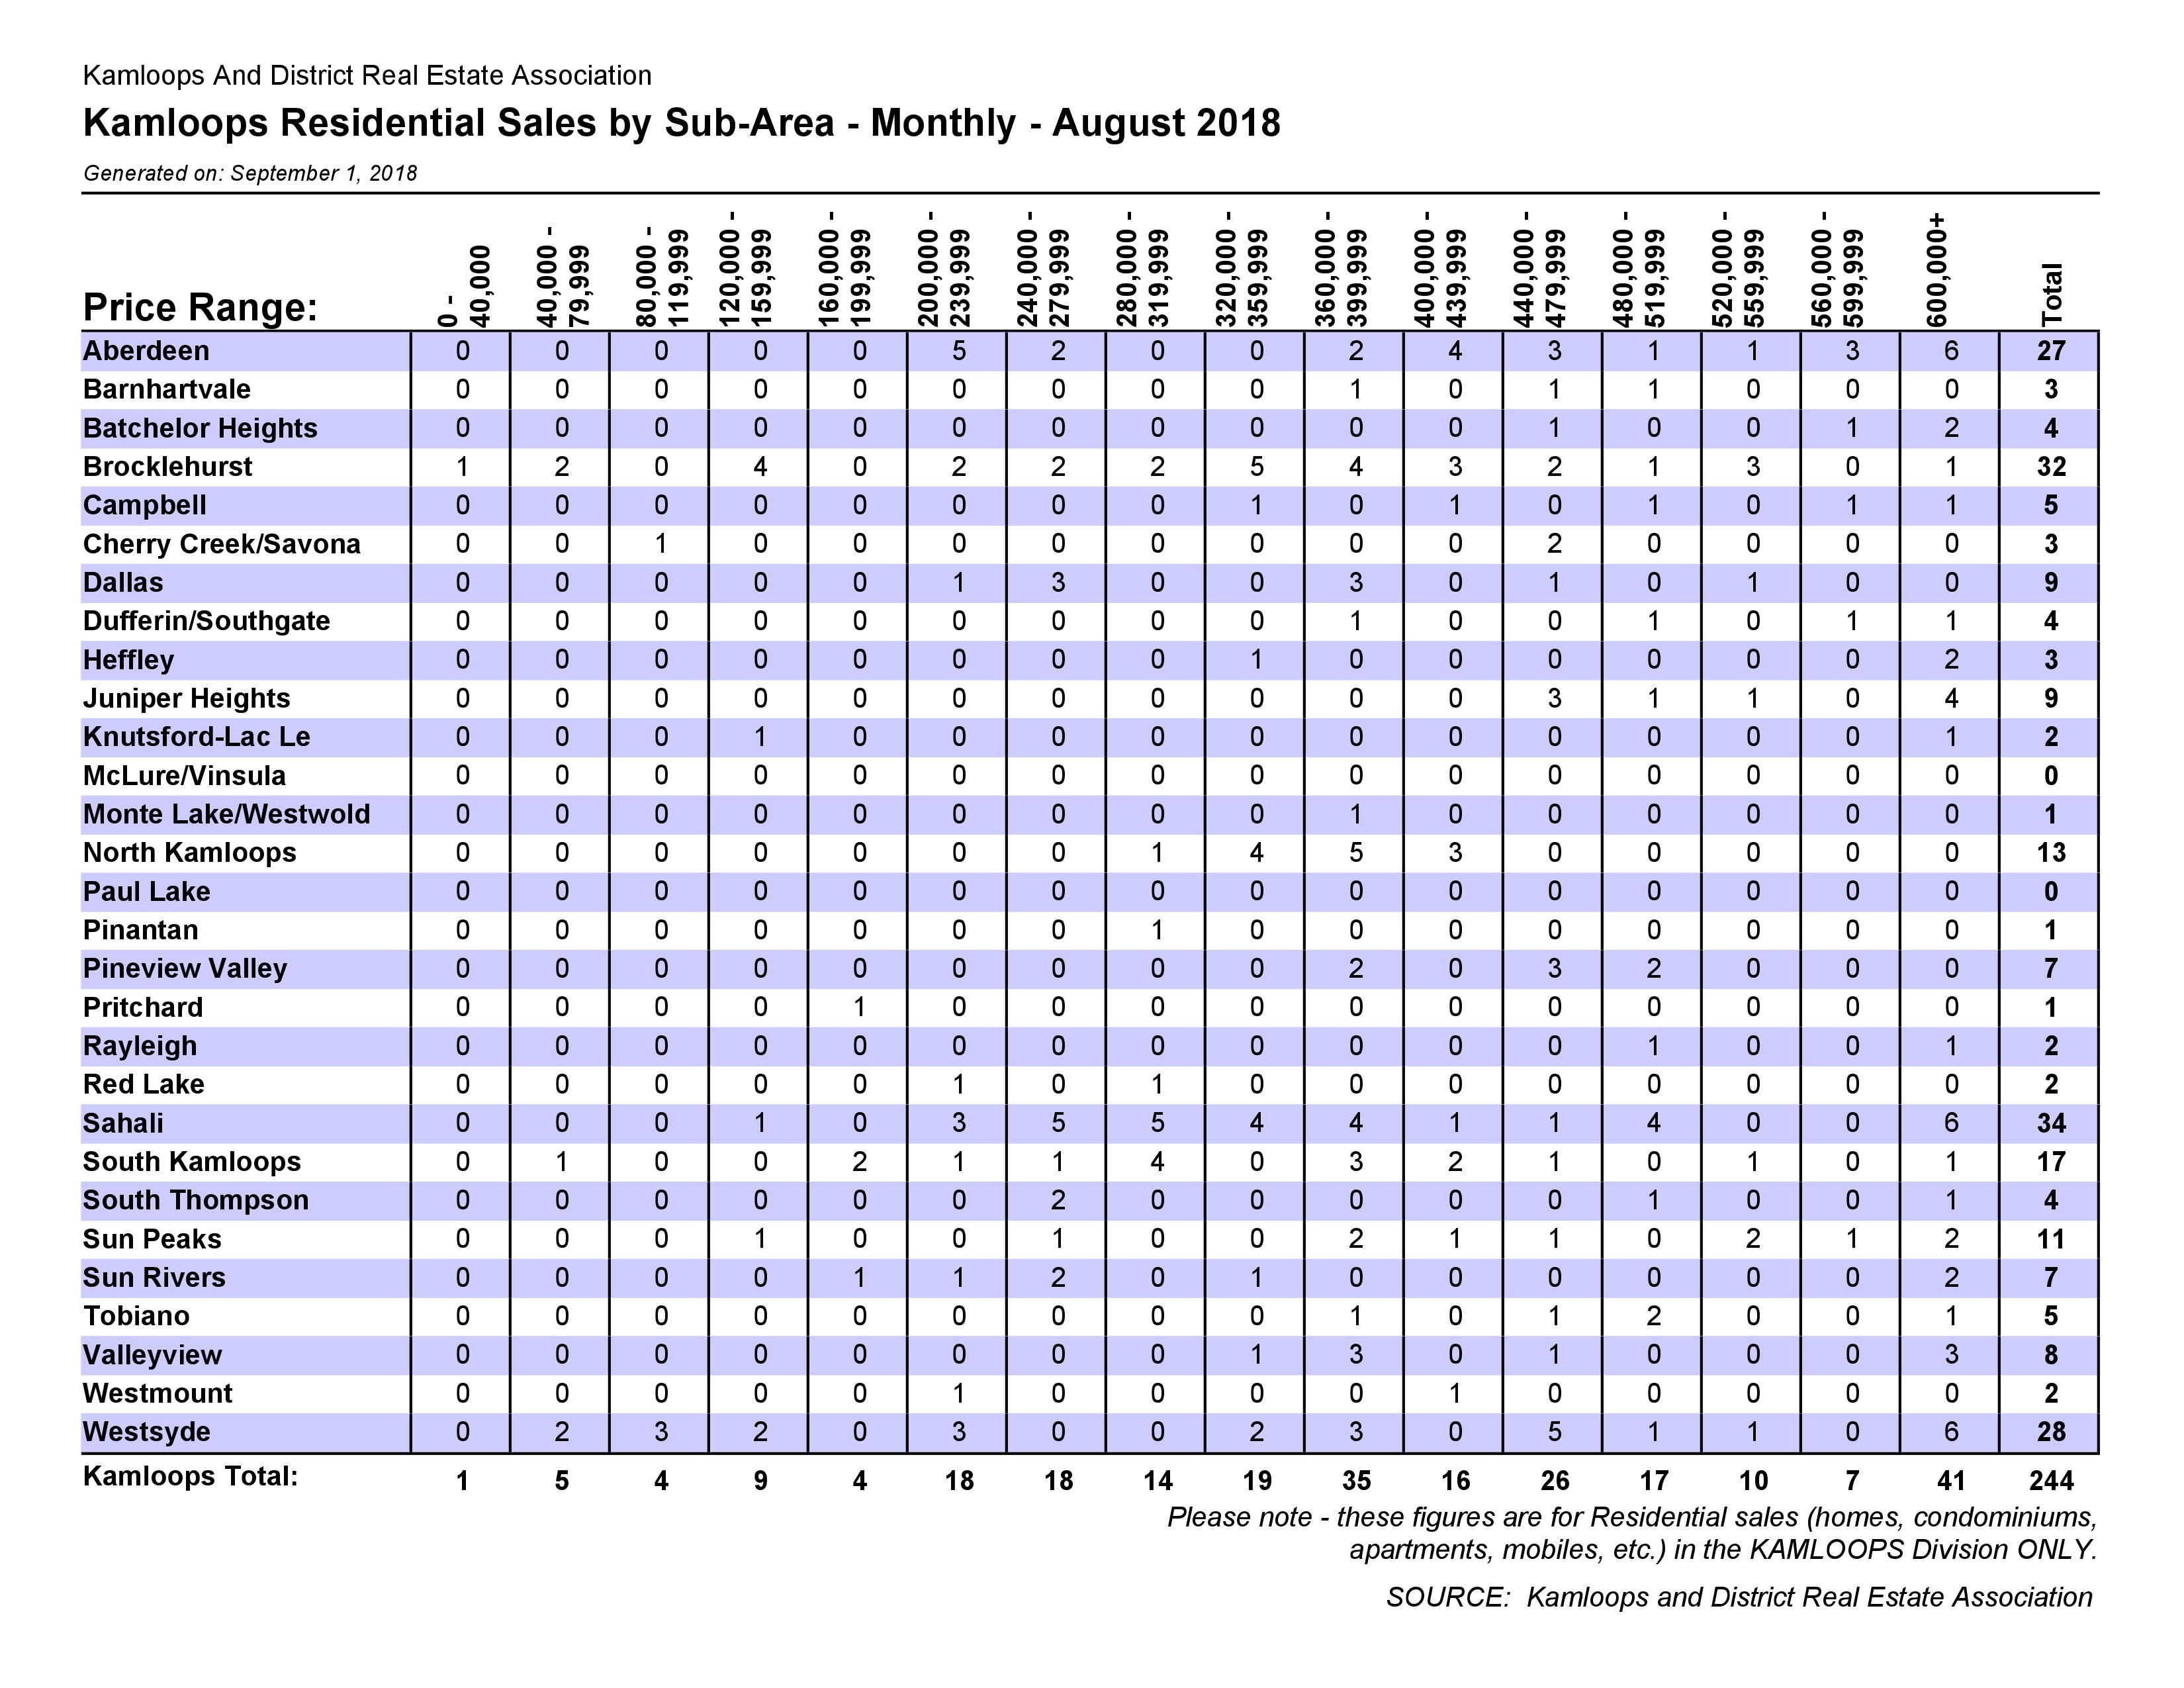
The Kamloops District Real Estate Association has released the latest Statistics for August 2018. Click on the image below to enlarge or PDF documents included in the links below.
Vancouver, BC – August 20, 2018. The British Columbia Real Estate Association (BCREA) released its 2018 Third Quarter Housing Forecast Update today.
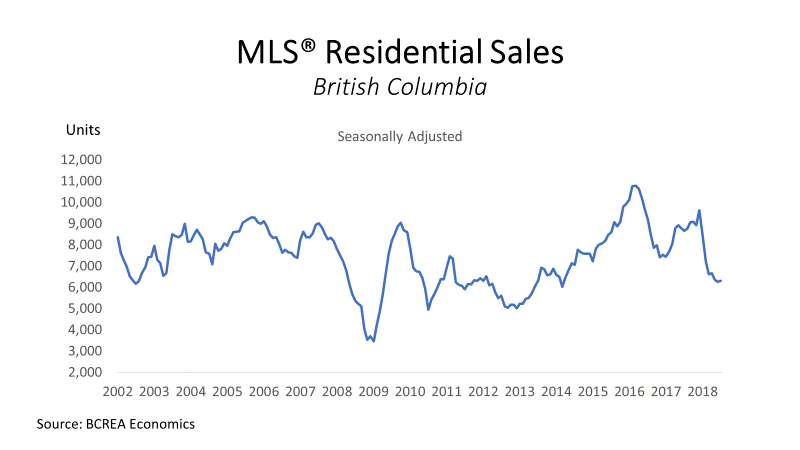
Multiple Listing Service® (MLS®) residential sales in the province are forecast to decline 21 per cent to 82,000 units this year, after recording 103,768 residential sales in 2017. MLS® residential sales are forecast to increase 8 per cent to 88,700 units in 2019. The 10-year average for MLS® residential sales in the province is 84,800 units.
“The BC housing market is grappling with a sharp decline in affordability caused by tough B20 stress test rules for conventional mortgages,” said Cameron Muir, BCREA Chief Economist. “While these rules have had a negative effect on housing demand across the country, the impact has been especially severe in BC’s large urban centres because of already strained housing affordability.”
In spite of the policy-driven downturn in housing demand, strong fundamentals continue to underpin the market. Demographics are highly favourable, especially the millennial generation who are now entering their household-forming years. In addition, low unemployment is leading to significant upward pressure on wages and, by extension, household wealth and confidence.
The pullback in BC home sales is helping alleviate a chronic shortage of supply. After trending at decade lows, active listings in the province were up nearly 20 per cent in July. The combination of slower housing demand and an increase in the inventory of homes for sale has trended most markets toward balanced conditions. This means more selection for home buyers, fewer multiple offer situations and less upward pressure on home prices.
Vancouver, BC – August 13, 2018. The British Columbia Real Estate Association (BCREA) reports that a total of 7,055 residential unit sales were recorded by the Multiple Listing Service® (MLS®) across the province in July, a 23.9 per cent decrease from the same month last year. The average MLS® residential price in BC was $695,990, down 0.4 per cent from July 2017. Total sales dollar volume was $4.9 billion, a 24.2 per cent decline from July 2017.
“The BC housing market continues to grapple with the sharp decline in affordability caused by tough new mortgage qualification rules,” said Cameron Muir, BCREA Chief Economist. “However, less frenetic housing demand has created more balanced market conditions in many regions, leading to fewer multiple offers and more choice for consumers.”
Year-to-date, BC residential sales dollar volume was down 18.9 per cent to $37 billion, compared with the same period in 2017. Residential unit sales decreased 20.6 per cent to 50,926 units, while the average MLS® residential price was up 2.1 per cent to $725,639.

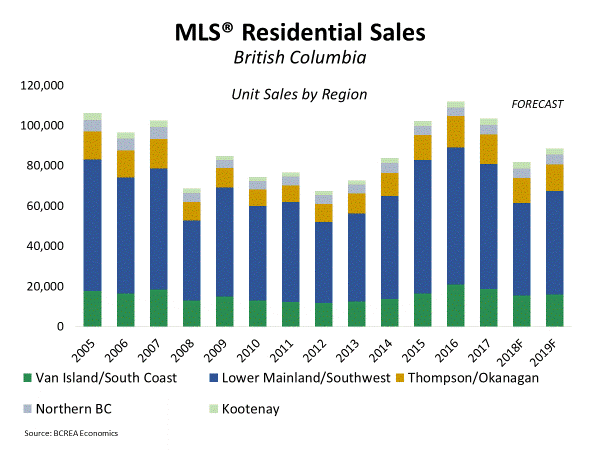 Multiple Listing Service® (MLS®) residential sales in the province are forecast to decline 21 per cent to 82,000 units this year, after recording 103,768 residential sales in 2017. MLS® residential sales are forecast to increase 8 per cent to 88,700 units in 2019. The 10-year average for MLS® residential sales in the province is 84,800 units.