The Kamloops District Real Estate Association has released the latest Statistics for November 2018. Click on the image below to enlarge or PDF documents included in the links below.
BC Real Estate Association (BCREA) Deputy Chief Economist Brendon Ogmundson discusses the October 2018 statistics.
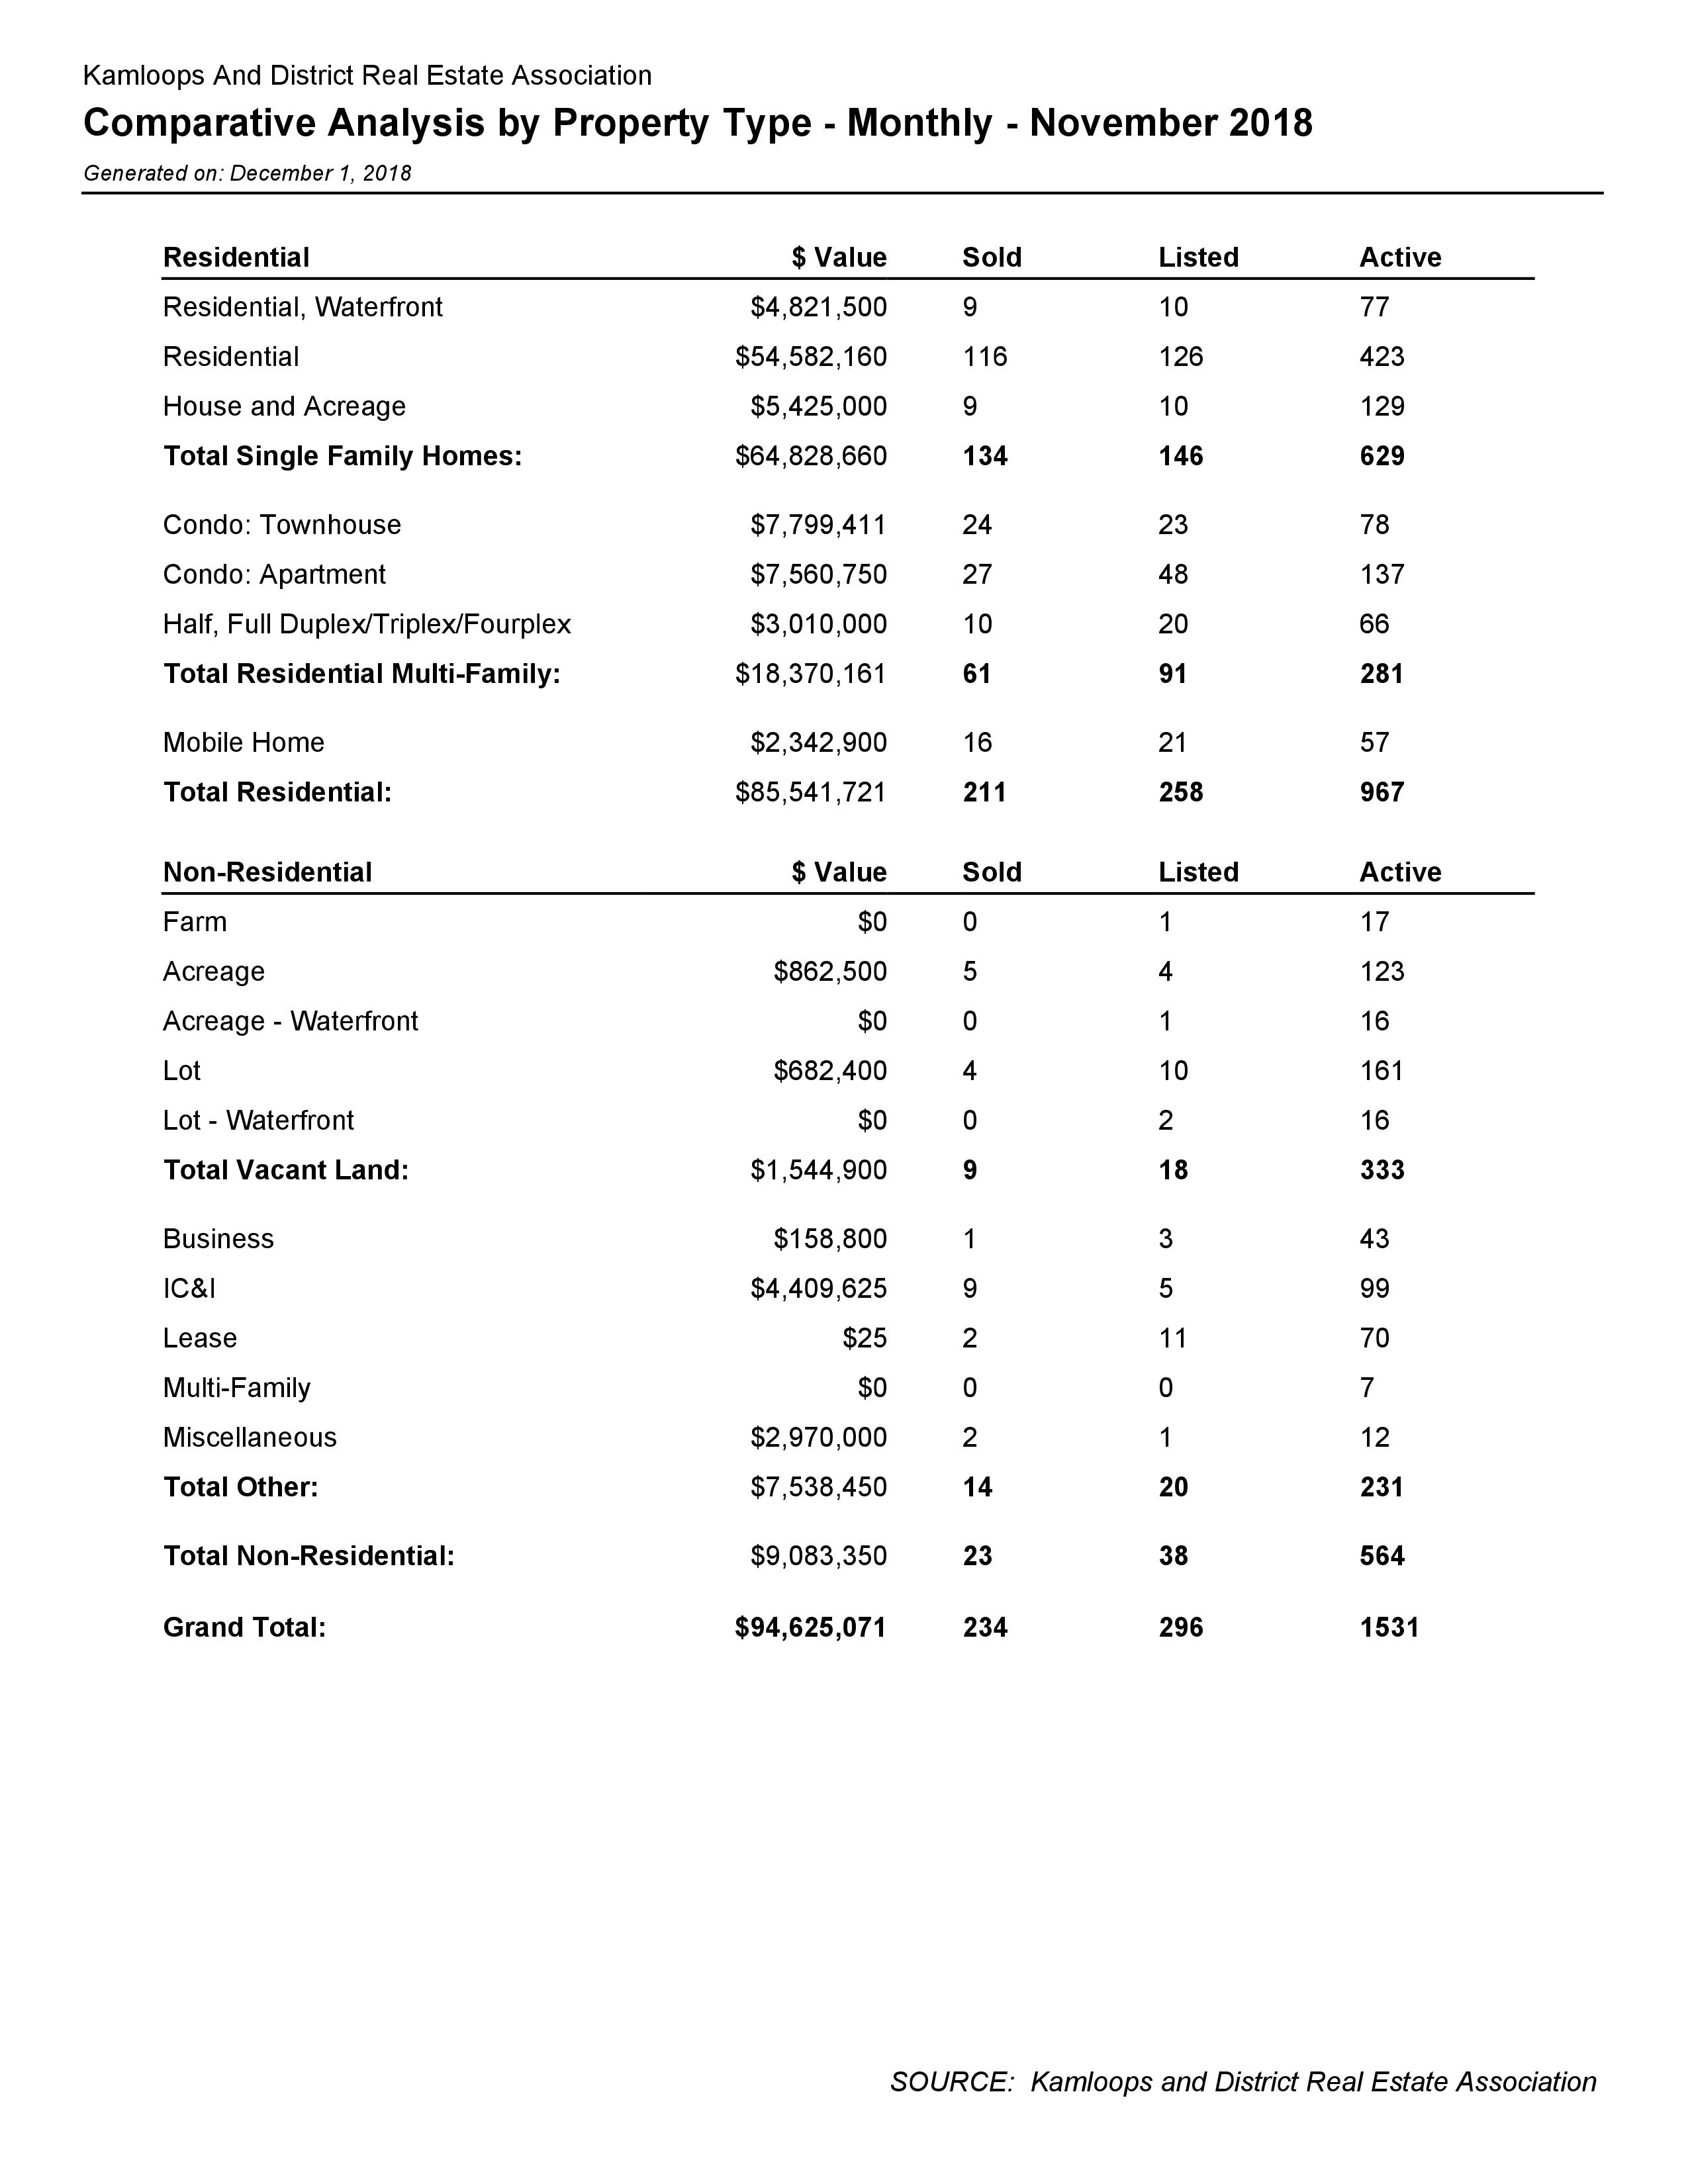
The Kamloops market is still active but we have seen a decline in the number of unit sales year over year by 21.3%. However, there was an increase in the average price year over year by 16.3%.
Vancouver, BC – November 14, 2018. The British Columbia Real Estate Association (BCREA) reports that a total of 6,405 residential unit sales were recorded by the Multiple Listing Service® (MLS®) across the province in October, down 26.2 per cent from the same month last year. The average MLS® residential price in BC was $690,161, a decline of 4.1 per cent from October 2017. Total sales dollar volume was $4.2 billion, a 29.3 per cent decline from October 2017.
“The BC housing market continued to grapple with tougher mortgage qualifications in October,” said Cameron Muir, BCREA Chief Economist. “However, more moderate consumer demand has led to a much-needed increase in the supply of homes for sale.”
Total active residential listings were up nearly 30 per cent to 36,195 units in October, compared to the same month last year. While the BC housing market exhibited balanced conditions overall in October, market conditions do vary between regions and by product type.
Year-to-date, BC residential sales dollar volume was down 22.1 per cent to $49.7 billion, compared with the same period in 2017. Residential unit sales decreased 22.8 per cent to 69,664 units, while the average MLS® residential price was up 1 per cent to $713,662.
Vancouver, BC – November 8, 2018. The British Columbia Real Estate Association (BCREA) released its 2018 Fourth Quarter Housing Forecast today.
Multiple Listing Service® (MLS®) residential sales in the province are forecast to decline 23 per cent to 80,000 units this year, after recording 103,768 residential sales in 2017. MLS® residential sales are forecast to increase 12 per cent to 89,500 units in 2019. The 10-year average for MLS® residential sales in the province is 84,800 units.
“The marked erosion of affordability and purchasing power caused by the mortgage stress test and rising interest rates continue to be a drag on the housing demand,” said Cameron Muir, BCREA Chief Economist. “However, continuing strong performance in the economy combined with favourable demographics is expected to push home sales above their 10-year average in 2019.”
Despite the mortgage policy drag on the sector, strong performance of the BC economy continues to be highly supportive of housing demand. Five consecutive years of above trend growth in the province has led to a high level of employment and an unemployment rate that appears to be at a cyclical low.
The combination of fewer home sales and a larger inventory of homes for sale has helped trend most markets to balanced conditions. As a result, home price growth has slowed considerably, and is expected to more closely reflect overall consumer price inflation through 2019. In addition, a record number of homes are under construction in BC, which will provide for much needed expansion of the housing stock and greater price stability.