
5 Tips for Buying in the Kamloops Buyers Market.
Did you know that the Kamloops real estate market is trending towards a Buyers’ market! This is what we hear from the British Columbia Real Estate Association whose October 2022 statistics release states that provincially we are in a balanced market with some regional variations pushing into Buyers’ market territory.
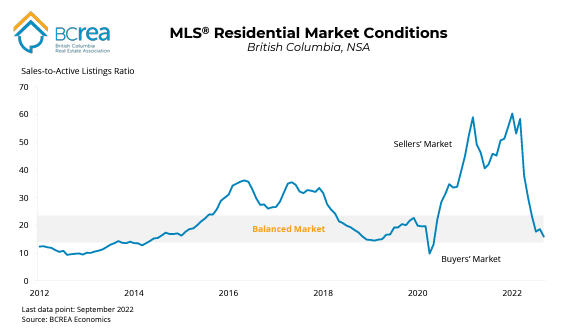
Provincially sales were down 45.8% year over year with active listings up 40.5% across the province.
It is a great time to buy, prices are coming down, there are a lot of homes to choose from and some sellers are getting more anxious to sell their homes. On the other hand, there is the belief that it may not be a good time to buy. Prices may fall further and the interest rates are higher than the historically low levels we saw in recent years. How do you know when the best time is to buy a home in Kamloops? Below there are five things to consider if you are trying to decide if now is the right time to purchase your own Kamloops property.
- Timing the BOTTOM is very difficult for many reasons. The timing of the bottom of the market is different in every region. Just because the market has bottomed in one region of BC doesn’t mean that the same is happening here in Kamloops. There are many different factors that go into the state of every market. Waiting for the absolute bottom often causes buyers to miss it and get stuck in the upswing of the market, making purchasing a home more difficult. Buy a home because you need to or because you have found the right one for you, not because you are waiting for the bottom. Often the bottom is only seen in the rear-view mirror.
- Often the best places in Kamloops sell FIRST. If you find a home in Kamloops that is perfectly suited to your needs and desires, then buy it! When that perfect home comes along, and you chose to wait it can be scooped up from under you. Often if a home is desirable to you, it is also very desirable to others looking. Buyers must put some value on a home that meets or exceeds their needs that is not a monetary value. Desirable homes in desirable areas in a down market hold their value much better than less desirable homes in less desirable areas. You can check out up to date information here with new listings posted daily.
- Find a home you can GROW with. Think long-term when purchasing your Kamloops home. Find a place that you can see yourself in for years to come. The Real Estate market is cyclical with ups and downs. If the market is on the decline now, there is no telling when that will change. We all wish that we had a crystal ball to predict the future, but that just isn’t the case. Over the long-term real estate has proven to be a good investment, so thinking long term will help with your decision.
- Use TECHNOLOGY in your Kamloops home search. The internet has a wealth of information on home buying. Realtors have access to private client search databases which can help you research and buy in the Kamloops market. Use the internet to your advantage! Talk to our Team today about setting up a private client search tailored to your specific criteria. Keep track of new listings in the Kamloops area that match your criteria. You also get access to the sale prices of those homes. This makes it very easy to make an informed decision about your Kamloops home purchase. We would be happy to set up your Kamloops real estate search for you!
- BUYERS AGENTS are there to help you! Find yourself a good buyers’ agent who will help you search through all the listings in the Kamloops area. A buyers’ agent will find the best suited homes for you. There are other advantages of having your own buyers’ agent including: they arrange appointments for you which work for your schedule, they have local knowledge which can prevent you from unknowingly making a bad purchase, they keep you up to date on current Kamloops market conditions, prepare a comparative market analysis on any home you may be interested in purchasing, and finally negotiate a favorable contract. Most people are not well versed on contract negotiation and buying real estate, having an agent on your side is always beneficial. Don’t forget, the best part about having your own representation is it is FREE! We have a number of Buyers’ Agents to choose from. It is great to work with someone you trust and enjoy spending time with. Read about our Agents here.
There are many factors that go into your decision to purchase a home in Kamloops. Buyers have their own personal reason for purchasing and you can’t time the market. Become an informed buyer, help yourself in this dynamic market. Remember, knowledge is power!
Contact us anytime to set up a personalized search. We are here to answer any question you have.
Are you looking for more information about Buying a home in Kamloops? View our Buyer resources here.
Are you a Seller and you are trying to decide it now is the right time to sell? We would be happy to arrange a free, no obligation home evaluation. Contact us anytime!.

