Year off to strong start in construction sector

For the second month in a row, the value of building permits issued in Kamloops has exceeded 2012 monthly totals.

The city doled out $6.6-million worth of permits in February, compared to $4.2 million in the same period in 2012.

But, bucking the trend of late, February’s  surge wasn’t driven by commercial construction.

Commercial projects accounted for only $814,091 of the month’s totals, while residential-permit values totaled $5.7 million.

In 2012, residential construction accounted for only $1.3 million of permit value.

Multi-family projects accounted for the greatest amount of permit value, at $3.1 million.

Development and engineering director Marvin Kwiatkowski said that’s a trend that will likely continue.

“It’ll be higher than last year and you see that already,” he said.

A number of larger projects have yet to come through and the city is predicting it will add about 220 multi-family dwelling units by year’s end.

After a run of big-ticket commercial projects in previous months, Kwiatkowski said there aren’t many more major builds on the horizon.

On the institutional side, however, the city is expecting a $30-million bump from permits for the Royal Inland Hospital’s new clinical- services and parking building some time this year.

So far, the city has handed out $23.4 million in permits for 2013, compared to $18.8 million at this time last year.

By Andrea Klassen – Kamloops This Week

Link

BC Commercial Leading Indicator Edges Lower in Fourth Quarter

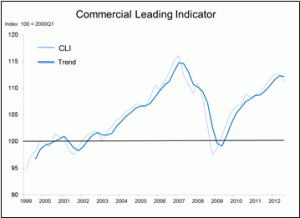
Vancouver, BC – February 28, 2013. The British Columbia Real Estate Association (BCREA) Commercial Leading Indicator (CLI) edged lower by 1.3 points in the fourth quarter of 2012, to an index level of 111.3. On a year-over-year basis, the CLI was up 0.8 per cent during the fourth quarter of 2012.

BC Commercial Leading Indicator 2013


The decline in the CLI translates to a slight rolling over in the underlying index trend, signaling a potential slowing of activity for the first half of 2013.

“A modest slowing of commercial real estate activity is in general accord with 2013 being somewhat of a transition year for the economy,” said Brendon Ogmundson, BCREA Economist. “We anticipate that slower growth through the first half of 2013 will give way to a more robust economy in 2014 and therefore an increase in commercial market activity.”

Link

Real estate affordability improves, but B.C. still most expensive province to own a home

British Columbia’s housing affordability saw noticeable improvements in the fourth quarter of 2012, but it remains the priciest province in which to own a home, the latest Housing Trends and Affordability Report released today by RBC Economics Research shows.

“Affordability improvements across most housing types in the fourth quarter were welcome news to prospective buyers in British Columbia,” said Craig Wright, senior vice-president and chief economist, RBC. “Still, the market has a long way to go before affordability reaches less stressful levels.”

In Metro Vancouver, home resales fell 23 per cent in 2012 to the lowest level in 12 years, excluding the recession of 2008, RBC said. While the RBC report says poor affordability is a key factor behind the 11.9-per-cent drop in home resales in the province in 2012 compared to 2011, other databases offer a more nuanced picture of housing affordability in Metro Vancouver.

The Vancouver Sun introduced the UDI/FortisBC Housing Affordability Index earlier this month to provide a more contextual and in-depth look at housing affordability across Metro Vancouver.

This index found that outside of the city of Vancouver — notably in suburbs like Surrey and Maple Ridge — the housing market remains affordable to people earning average incomes.

The significant differences between the RBC Housing Affordability Measures and The Vancouver Sun UDI/FortisBC Housing Affordability Index is that RBC expresses the percentage of an average income that is required to service the debt on a home and does not separate out the different areas of Metro Vancouver, while the UDI/Fortis Index looks at the percentage of households in a given region that can afford to buy a home in that specific region, using no more than 32 per cent of their income.

“The UDI/FortisBC Housing Affordability Index powered by Urban Analytics provides a better representation of what you can afford to buy and where in Metro Vancouver, because we looked at the different geographic regions separately,” said Michael Ferreira, principal at Urban Analytics, a company that provides research and advisory services for the new home industry.

RBC’s housing affordability measures track the proportion of pre-tax household income needed to service the costs of owning a home at market values — it puts the cost of owning in B.C. at 66.4 per cent of median household incomes for a detached bungalow, 72.7 per cent for a two-storey home and 33.4 per cent for condominiums. These were all down from the previous quarter, except for the two-storey home category, which went up 0.4 per cent after a 3.2 per cent drop last quarter, as prices declined between 0.8 and four per cent across the region.

For Vancouver, the RBC data shows a detached bungalow costs 82.2 per cent of median income, including mortgage payments, utilities and property taxes.

The UDI/FortisBC Housing Affordability Index breaks Metro Vancouver into three areas: the city of Vancouver, Inner Metro (West Vancouver, North Vancouver, Burnaby, New Westminster, Richmond, South Delta, Coquitlam, Port Moody, Port Coquitlam) and Outer Metro (Surrey, Langley, North Delta, White Rock, Pitt Meadows and Maple Ridge).

Splitting the region into three areas means the numbers are not skewed so heavily by the priciest markets like the west side of Vancouver, Ferreira said.

The index shows that the majority of households in outer Metro can afford the payments on all types of homes, both new and resale. It found that as many as 82.9 per cent of households in outer Metro could make the payments on a resale wood-frame condo, while 80.4 per cent could afford a resale concrete condo.

For inner Metro, the index found that while 64.5 per cent of working households can afford a resale wood-frame condo, just 51.7 per cent of working households can afford a new concrete condo and less than 40.9 per cent of households could afford a single-family home.

In Vancouver proper, the UDI/FortisBC Affordability Index shows that housing is affordable for a far smaller percentage of the population — fewer than 32 per cent of households can afford payments on a single-family home, a new or resale townhouse or a new concrete condominium

By Tracy Sherlock, Vancouver Sun

Link

CMHC: Housing Starts Lower in 2013, Increasing Modestly in 2014

OTTAWA, February 22, 2013 — Moderation in economic and employment growth in the second half of 2012 has led to more modest housing demand. With continued moderation expected in the first half of 2013, total annual housing starts are expected to be lower in 2013 relative to 2012, according to Canada Mortgage and Housing Corporation’s (CMHC) first quarter 2013 Housing Market Outlook, Canada Edition1.

As fundamentals, including employment, economic growth and net migration are expected to gain momentum later in 2013 and in 2014, housing starts are expected to trend slightly higher next year.

“CMHC expects housing construction activity will trend lower in the first half of 2013, before gaining more momentum by the end of the year as economic and employment growth remain supportive of the Canadian housing market,” said Mathieu Laberge, Deputy Chief Economist for CMHC. “In 2014, improving economic conditions may be partially offset by a slight moderation in the number of first-time homebuyers, and potential small and steady increases in mortgage interest rates.”

On an annual basis, housing starts are expected to range between 178,600 to 202,000 units in 2013, with a point forecast of 190,300 units, following a level of 214,827 units in 2012. In 2014, housing starts are expected to range from 171,200 to 217,000 units, with a point forecast of 194,100 units.

Existing home sales are expected to range between 418,200 to 484,000 units in 2013, with a point forecast of 451,100 units, following a level of 453,372 in 2012. In 2014, Multiple Listing Service® (MLS®2) sales are expected to range from 439,600 to 505,000 units, with an increase in the point forecast to 472,300 units.

The average MLS® price is forecast to be between $356,500 and $378,500 in 2013 and between $363,800 and $390,800 in 2014. CMHC’s point forecast for the average MLS® price calls for a 1 per cent gain to $367,500 in 2013 and a further 2.7 per cent gain to $377,300 in 2014.

As Canada’s national housing agency, CMHC draws on more than 65 years of experience to help Canadians access a variety of quality, environmentally sustainable and affordable housing solutions. CMHC also provides reliable, impartial and up-to-date housing market reports, analysis and knowledge to support and assist consumers and the housing industry in making informed decisions.

Link

1 2 3 4 10