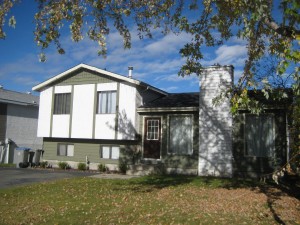
Featured Property: 490 Garibaldi Drive, Upper Sahali, Kamloops, B.C. $312,900

To view all homes for sale in Kamloops click here.
MLS Listings, News & Statistics


To view all homes for sale in Kamloops click here.

To view all homes for sale in Kamloops click here.

To view all homes for sale in Kamloops click here.
The Demographia 6th Annual International Housing Affordability Survey for 2010 is out. It rates metropolitan markets for affordability of the housing in each market. Australia, Canada, Ireland, New Zealand, the United Kingdom and the United States are all discussed. I have included a portion of the report below. You can access the full report by clicking the link at the bottom of this post.
The 6th Annual Demographia International Housing Affordability Survey expands coverage to 272 markets in Australia, Canada, Ireland, New Zealand, the United Kingdom and the United States. The Demographia International Housing Affordability Survey employs the “Median Multiple” (median house price divided by gross annual median household income) to rate housing affordability (Table ES-1).
___________________________________________________________
TABLE ES-1 HOUSING AFFORDABILITY RATING CATEGORIES RATING MEDIAN MULTIPLE Severely Unaffordable 5.1 & overHistorically, the Median Multiple has been remarkably similar among the nations surveyed, with median house prices being generally 3.0 or less times median household incomes. This affordability relationship continues in many housing markets of the United States and Canada. However, the Median Multiple has escalated sharply in Australia, Ireland, New Zealand and the United Kingdom and in some markets of Canada and the United States in recent years.
Over the past year, housing affordability has improved in some markets, remained constant in others and declined in still others. In the United States and the United Kingdom, the “bubble” markets that had “burst” generally reached a trough and began rising again. In the “boom” markets that did not experience a bubble, house prices generally declined in response to the intense economic disruption that occurred after the Lehman Brother‟s collapse, which signaled the “mortgage meltdown” and the “Great Recession,” the steepest economic decline since the Great Depression.
An Increase in Affordable Markets: Of the 272 markets surveyed, there were 103 affordable markets, 98 in the United States and 5 in Canada. This is an improvement from 87 in 2008. As before, the affordable markets include the three highest demand markets with more than 5,000,000 population in the high-income world, Atlanta, Dallas-Fort Worth and Houston. Overall, 19 major markets (more than 1,000,000 residents) in the United States were also affordable (Table ES-2). As in the past, all of these markets were characterized by “more responsive” land use regulation, as opposed to “more prescriptive” land use regulation (see Table 2 in Section 1). Severely Unaffordable Markets: There were 62 severel unaffordable markets this year, down from 64 in 2008. The least affordable markets were concentrated in Australia (22) the United Kingdom (19) and the United States (11). Nine of the 11 US severely unaffordable markets were in California. There were 5 severely unaffordable markets in New Zealand and 5 in Canada (Table ES- 3). However, many of these severely unaffordable markets have experienced steep price declines in the last year. Among the major markets, Vancouver is the least affordable, with a Median Multiple of 9.3, followed by Sydney (9.1), Melbourne (8.0), Adelaide (7.4), London (7.1), New York (7.0) and San Francisco (7.0). As in the past, all of these markets were characterized by more prescriptive land use regulation (such as “compact city,” “urban consolidation,” “growth management” or “smart growth” policies), which materially increase the price of land, which makes housing unaffordable. The national distribution of housing affordability is indicated in Table ES-4.
To read the rest of this report click on the following link: 6th Annual Demographia International Housing Affordability Survey 2010