Home Sales Rise Outside Lower Mainland, BCREA

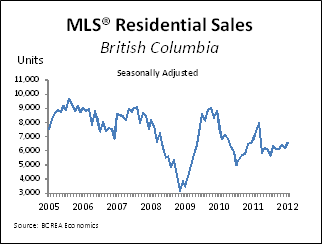
Vancouver, BC – February 15, 2012. The British Columbia Real Estate Association (BCREA) reports that the dollar volume of homes sold through Multiple Listing Service® (MLS®) in BC dipped 7.6 per cent to $2.1 billion in January compared to the same month last year. A total of 3,976 homes traded hands on the MLS® over the same period, down 3.9 per cent. The average MLS® residential price was 3.8 per cent lower at $527,219 compared to January 2011.

MLS Residential Sales BC January February 2012

Click to enlarge

“Increased market activity outside the Lower Mainland in January was offset by fewer sales in Vancouver and the Fraser Valley,” said Cameron Muir, BCREA Chief Economist. MLS® Residential sales rose 7 per cent to 1,620 units outside the Lower Mainland, while declining 10 per cent to 2,356 units in Vancouver and the Fraser Valley.

“While provincial sales activity was down in January from year ago levels, consumer demand has posted modest improvement since last fall, driven by low mortgage interest rates and gradually improving economic conditions,” added Muir.

Full article click here.

Canadian Home Sales Pull Back in January 2012

This article appeared on the DigitalJournal.com on February 15th, 2012 (from Canada NewsWire).

OTTAWA, Feb. 15, 2012 /CNW/ – According to statistics released today by The Canadian Real Estate Association (CREA), national resale housing activity retreated in January 2012 from the strong finish reported for December 2011.

Highlights:

  •   Home sales were down 4.5% from December to January.
  • Actual (not seasonally adjusted) activity came in 4.0% above levels in January 2011, and stood even with the 5 and 10 year averages for January sales.
  • The number of newly listed homes edged down 1.4% from December to January.
  • With sales down by more than new listings, the national market shifted further into balanced territory.
  • The national average home price was up less than 2% year-over-year in January, ranking it among the smallest increases of the past year.

Sales activity recorded through the MLS® Systems of real estate Boards and Associations in Canada fell 4.5 per cent from December 2011 to January 2012. This marks the first monthly decline in national activity since August 2011 and the biggest monthly decline since July 2010. The monthly decline reversed a string of monthly increases over the closing months of last year, and returned national activity to where it stood at the end of the third quarter of 2011.

“The national housing market is stabilizing and remains well balanced,” said Gary Morse, CREA’s President. “That said, forecasts for economic and job growth going forward vary widely for different parts of the country, suggesting a possible continuation of a softening trend in some markets, as well as the potential that demand will pick up based on strong fundamentals in others. All real estate is local, so talk to your local REALTOR® to understand how price trends in your neighbourhood are shaping up.”

Activity was down in over half of all local markets in January from the previous month. Led by declines in Greater Toronto and Montréal, demand also softened in a number of other major urban centres including the Fraser Valley, Calgary, Edmonton, Winnipeg, Ottawa, and Greater Vancouver.

Actual (not seasonally adjusted) national sales activity was up four per cent from year-ago levels in January, the smallest year-over-year increase since last May. As was the case in a number of months last year, actual sales in January 2012 stood close to the five and ten year average for the month.

The number of newly listed homes edged down 1.4 per cent on a month-over-month basis in January following a 2.9 per cent increase in December. The monthly decline in new supply reflects a drop in new listings in a number of Canada’s largest urban centres, which offset a jump in new listings in Vancouver.

Sales fell in January shifting the national market back towards the mid-point of balanced territory and reversing the recent trend which had seen the market becoming tighter over the final four months of 2011. The national sales-to-new listings ratio, a measure of market balance, stood at 53.8 per cent in January, down from 55.5 per cent in December and 55.4 per cent in November.

Based on a sales-to-new listings ratio of between 40 to 60 per cent, 60 per cent of local markets were balanced in January. Compared to December, there were fewer buyers’ and sellers’ markets, and a greater number of balanced markets.

The number of months of inventory stood at six months at the end of January on a national basis, up from 5.7 months in December 2011 and returning it to where it stood in October 2011. The number of months of inventory represents the number of months it would take to sell current inventories at the current rate of sales activity, and is another measure of the balance between housing supply and demand.

The actual (not seasonally adjusted) national average price for homes sold in January 2012 was $348,178, representing an increase of 1.2 per cent from its year-ago level. This ranks among the smallest increases since late 2010.

On a seasonally adjusted basis, the national average home price rose 1.6 per cent on a month-over-month basis, marking a rebound from a decline of similar magnitude in December. This pattern mirrors the one playing out in the newly-launched MLS® Home Price Index (HPI), published on February 6.

“Year-over-year comparisons in the national average price are expected to become volatile and may turn negative, reflecting average price developments in the first half of 2011 in Vancouver,” said Gregory Klump, CREA’s Chief Economist. “At that time, high-end home sales in Vancouver’s priciest neighbourhoods surged to all-time record levels, which skewed the national average price upward considerably. A replay of this phenomenon is not expected this year. As a result, comparisons for national average price to year-ago levels over the coming months will reflect an upwardly skewed base effect. For this reason, year-over-year comparisons should be kept in perspective. Developments in the MLS® HPI will provide important guidance on price trends, since it is not affected by the problem of compositional shifts in the mix of sales activity.”

Link

Home Foreclosures Skyrocket in Kelowna, CBC News

This article appeared on the CBC news website on February 15th, 2012. I found this article interesting only because I have noticed an increase in the number of court ordered sales in Kamloops over the past year or so. Kelowna is a close neighbour and some of the economic factors that affect them also are present here in Kamloops.  There is a video on the CBC news website with this story. Click here to see the video.

Foreclosure Home For SaleHome foreclosures are on the rise in B.C.’s Central Okanagan in recent months, but local real estate agents disagree about who might be losing their homes.

There are more than 170 court-ordered sale properties on the market in the Central Okanagan, more than 10 times more than three years ago.

Real estate agent Jason Neumann says according to his estimates, in the last 30 days alone 60 new foreclosures were put on the market, and he calls it a disturbing trend.

Foreclosure are up in the Central Okanagan according to local real estate agents. Foreclosure are up in the Central Okanagan according to local real estate agents. (Reed Saxon/AP Photo)

Neumann is worried the number of foreclosures will bring the overall market down, hurting anyone who wants to sell their home.

“What do you tell your sellers that are not in foreclosure that are now up against something they didn’t see coming? It’s one of those things where the bank is going to have to do what it’s got to do to get it sold.”

Neumann thinks many working class families are losing their homes, but not all real estate agents agree.

Elton Ash, the vice-president of Remax Realty in Western Canada, says most of the foreclosed properties are from people who were trying to flip homes during the hot market a few years back.

“People weren’t able to achieve their goals in doing this and so they quit making payments,” he said.

“The market in the Okanagan has really come to a standstill on that speculative investment front, and that is really what has been a major portion of the court-ordered sale thing that has increased so dramatically.”

Ash says many Canadians are now buying vacation homes in the U.S., where prices are currently low, but he predicts prices will eventually rise in the U.S., and investment home buyers will again look to Kelowna.

Link

Record-setting Real Estate Sale in Sun Peaks, Kamloops This Week

This article appeared in the Kamloops This Week on February 10th, 2012 and was written by Jeremy Deutsch.

Sun Peaks Real Estate Douglas Court

Photo By Sotheby's Sun Peaks

If you had eyes on the most exclusive address at Sun Peaks, but were just holding off to make that purchase, you would be out of luck.

The most expensive home in the resort community was officially sold on Friday (Feb. 10) to a Canadian family for $3.4 million.

The chalet, which was listed through Sotheby’s International Realty Canada, hit the market in December of 2010 for $4.3 million.

Located on Douglas Court, the 4,500-square-foot full timber-frame home is the ultimate in winter luxury and comes fully furnished with a wine tasting and theatre room, an outdoor hot tub and a grand piano.

Liz Forster, managing broker at Sotheby’s International Realty Canada, said the sale is a sign that Sun Peaks has come of age offering some of the finest resort properties in the world.

She suggested the family could have bought property anywhere in the world.

“They decided on Sun Peaks because this is where they want to be,” Forster said, adding the buyers have frequented the resort and love the mountain.

She was unsure if the new owners would be moving to Sun Peaks permanently.

In 2010, a home on Sundance Drive sold for $2.2 million, beating the previous most expensive house at $1.5 million.

The $2.2 million home sold after being on the market for only two months.

In the case of the latest sale, Forster said a year is a typical time frame for a recreation property given the current market conditions.

It’s also another good news real estate story for a community on a roll.

Last June, the Pacific National Exhibition bought two lots at the Lookout Ridge area in Sun Peaks.

Though officials with the exhibition wouldn’t divulge exactly what the properties will be used for because of strict lottery rules, they are expected to be PNE prize homes in the coming years.

Forster noted there is interest in a couple of other properties in the $3-million range at the resort, which could also be sold in the near future.

Link

1 651 652 653 654 655 782