B.C. Housing Market Recovers from Summer Doldrums: BCREA November 2010

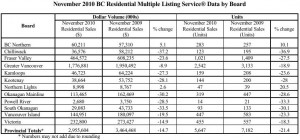
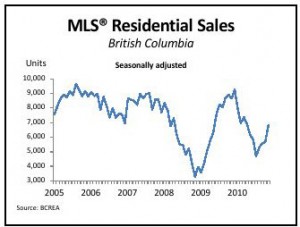
The British Columbia Real Estate Association (BCREA) reports that Multiple Listing Service® (MLS®) residential sales in the province climbed 20 per cent in November from October 2010, on a seasonally adjusted basis. Compared to November of last year, MLS® residential unit sales were down 21 per cent to 5,647 units. The average MLS® residential price rose 9 per cent to $523,394 in November compared to the same month last year.

BC MLS Residential Sales To November 2010

Click to enlarge

“Improved economic conditions and low mortgage interest rates have contributed to a 46 per cent increase in home sales since July,” said Cameron Muir, BCREA Chief Economist. Employment in BC eclipsed the July 2008 record by 2,600 jobs last month, while the unemployment rate dipped to 6.9 per cent, the lowest recorded since January 2009.

“The inventory of homes for sale has trended lower since last spring, improving market conditions in many areas of the province,” added Muir. Vancouver and Victoria climbed back into balanced market conditions in last month.

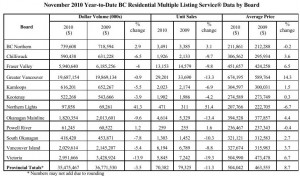
Year-to-date, BC residential sales dollar volume declined 4 per cent $35.5 billion, compared to the same period last year. Residential unit sales declined 11 per cent to 70,382 year-to-date, while the average MLS® residential price climbed 9 per cent to $504,042 over the same period.

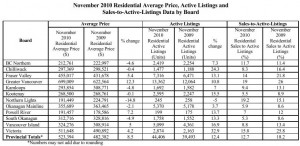
Click on the images below to enlarge.

November 2010 Residential Average Price Active Listings, Sales to active listings data by bc board copy

November 2010 BC Residential MLS

November 2010 Year to date Residential MLS


Kamloops and District Real Estate Associations Statistics For November 2010

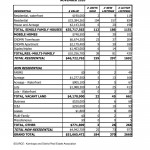
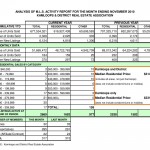
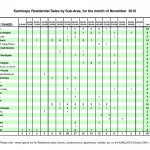
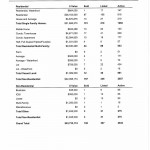
The Kamloops and District Real Estate Association has posted it’s latest statistics for November 2010. The number of residential sales are down in comparison to the same month last year however sales are slightly up in comparison to last month. Click on the images below to enlarge.
Comparative analysis by property type November 2010 Kamloops Real Estate Statistics0000

Kamloops Real Estate Comparative Analysis By Property Type November 2010

MLS Activity November 2010 Kamloops Real Estate Statistics

Kamloops Real Estate MLS Activity November 2010

Sales by Subarea November 2010 Kamloops Real Estate Statistics

Kamloops Real Estate Sales by Subarea November 2010

Kamloops and District Real Estate Associations Statistics For October 2010

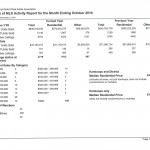
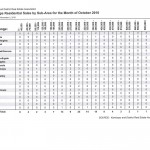
The Kamloops and District Real Estate Association has posted it’s latest statistics for October 2010. The number of residential sales has dropped in comparison to October 2009 (229 units in 2009 vs. 146 units in 2010). The median sale price is also down significantly from last month. However, the median sale price can easily be affected by a large volume of high priced home sales. Click on the images below to enlarge.
Comparative analysis by property type October 2010 Kamloops Real Estate Statistics

Kamloops Real Estate Comparative Analysis By Property Type October 2010

MLS Activity October 2010 Kamloops Real Estate Statistics

Kamloops Real Estate MLS Activity October 2010

Sales by Subarea October 2010 Kamloops Real Estate Statistics

Kamloops Real Estate Sales by Subarea October 2010

Kamloops and District Real Estate Associations Statistics For September 2010

The Kamloops and District Real Estate Association has posted it’s latest statistics for September 2010. Kamloops residential sales have definitely slowed in comparison to the number of residential sales for the same month in 2009. Click on the image below to enlarge.

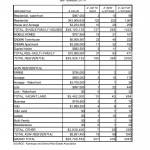
Comparative analysis by property type September 2010 Kamloops Real Estate Statistics

Kamloops Real Estate Comparative Analysis By Property Type September 2010

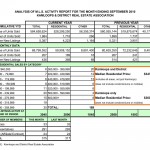
MLS Activity September 2010 Kamloops Real Estate Statistics

Kamloops Real Estate MLS Activity September 2010

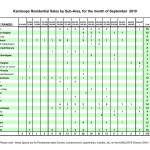
Sales by subarea September 2010 Kamloops Real Estate Statistics

Kamloops Real Estate Sales by Subarea September 2010

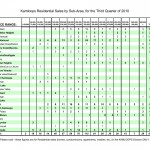
sales by subarea 3rd quarter 2010 Kamloops Real Estate Statistics

Kamloops Real Estate Sales by Subarea 3rd Quarter 2010

1 94 95 96 97 98 105