The Kamloops and District Real Estate Association has released it’s latest statistics for September 2013 and the 4th Quarter. Click on the image to enlarge.
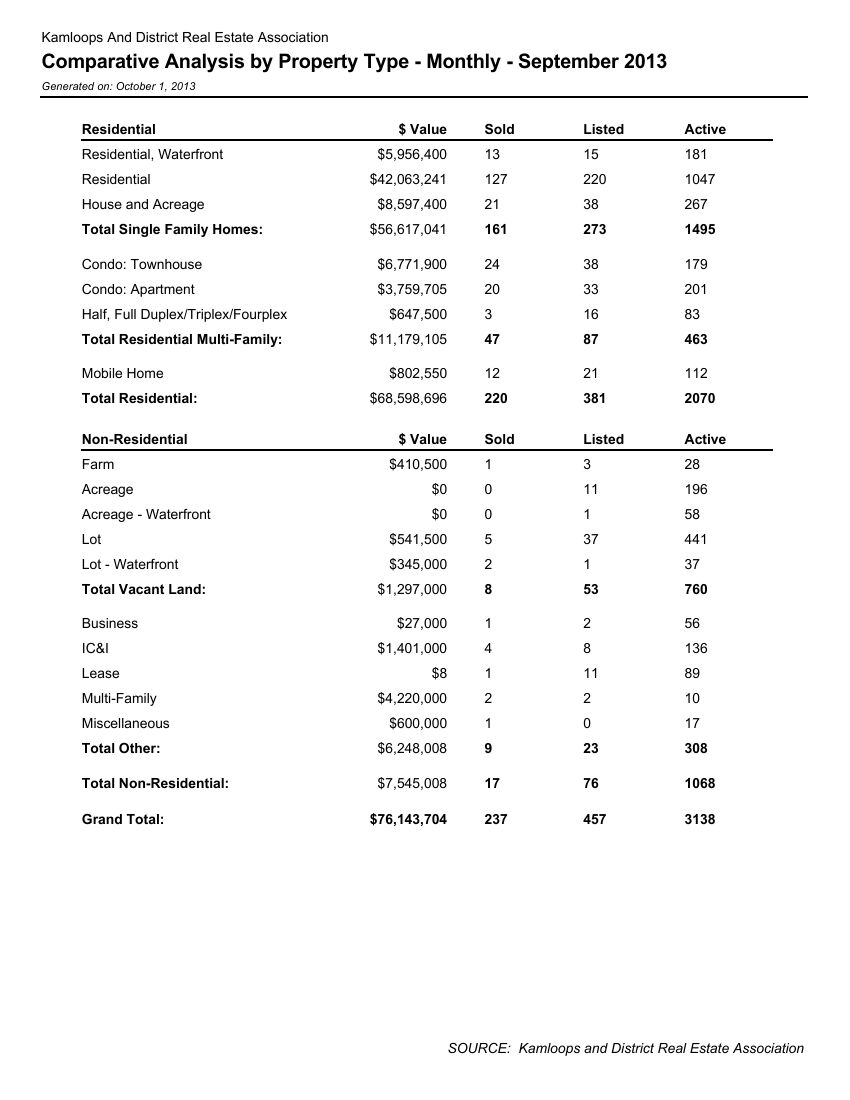
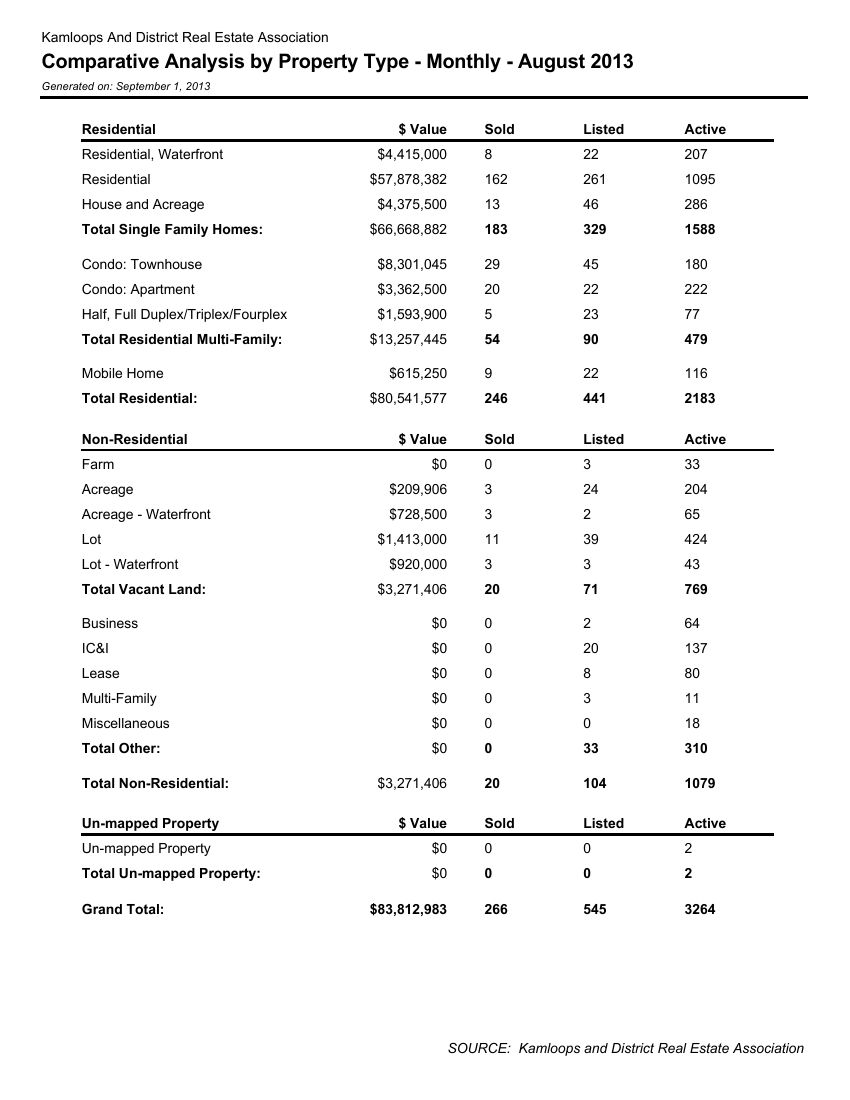
Kamloops Real Estate Comparative analysis by property type September 2013
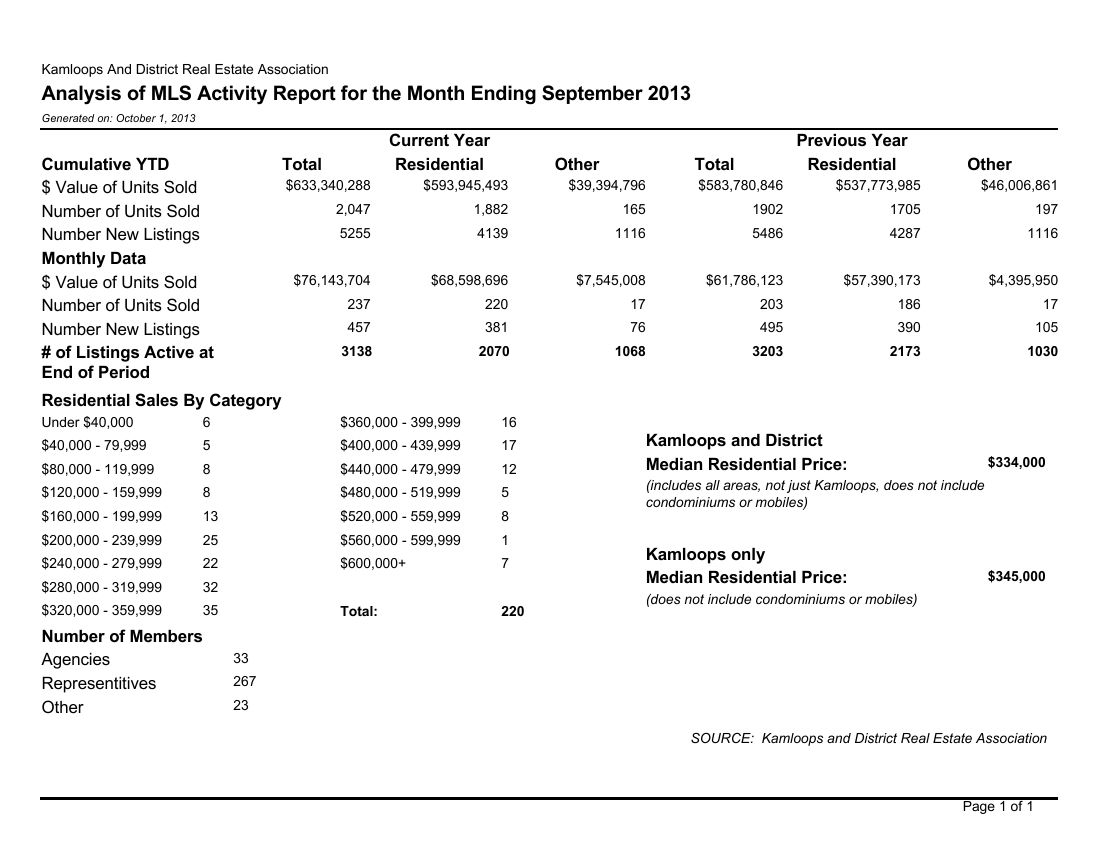
Kamloops Real Estate MLS Activity September 2013
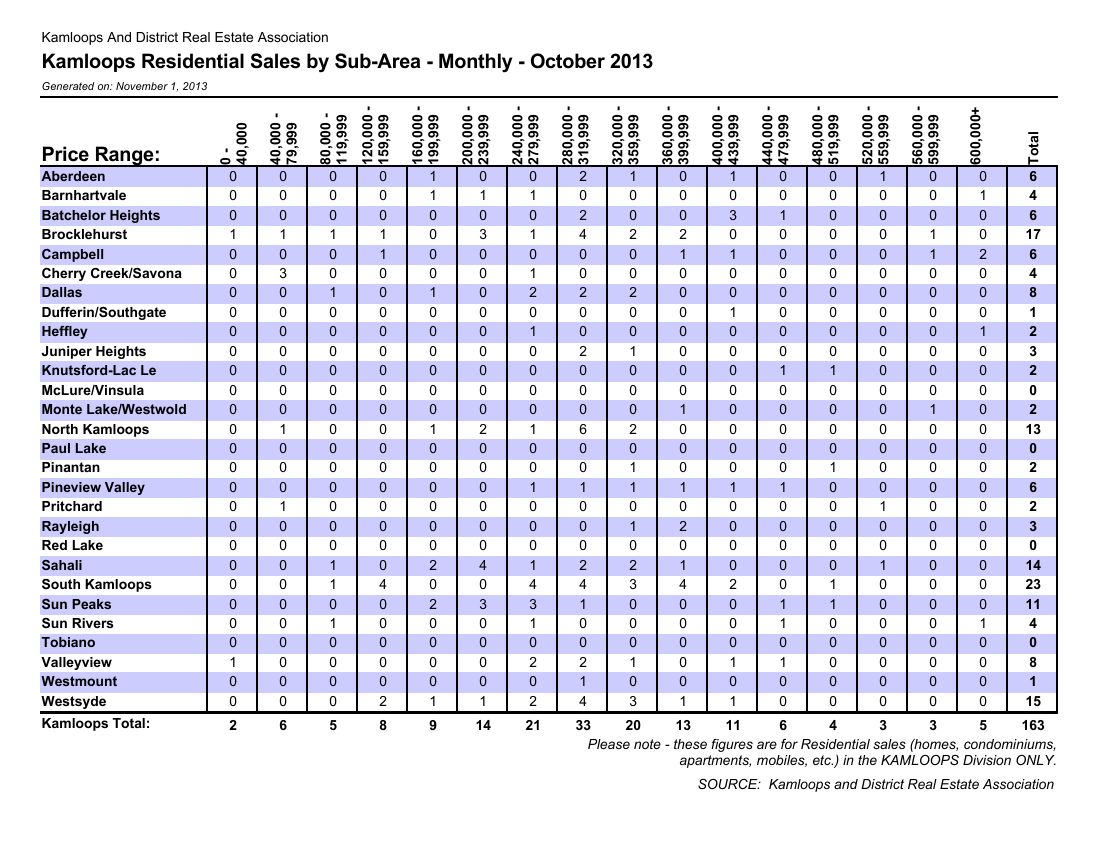
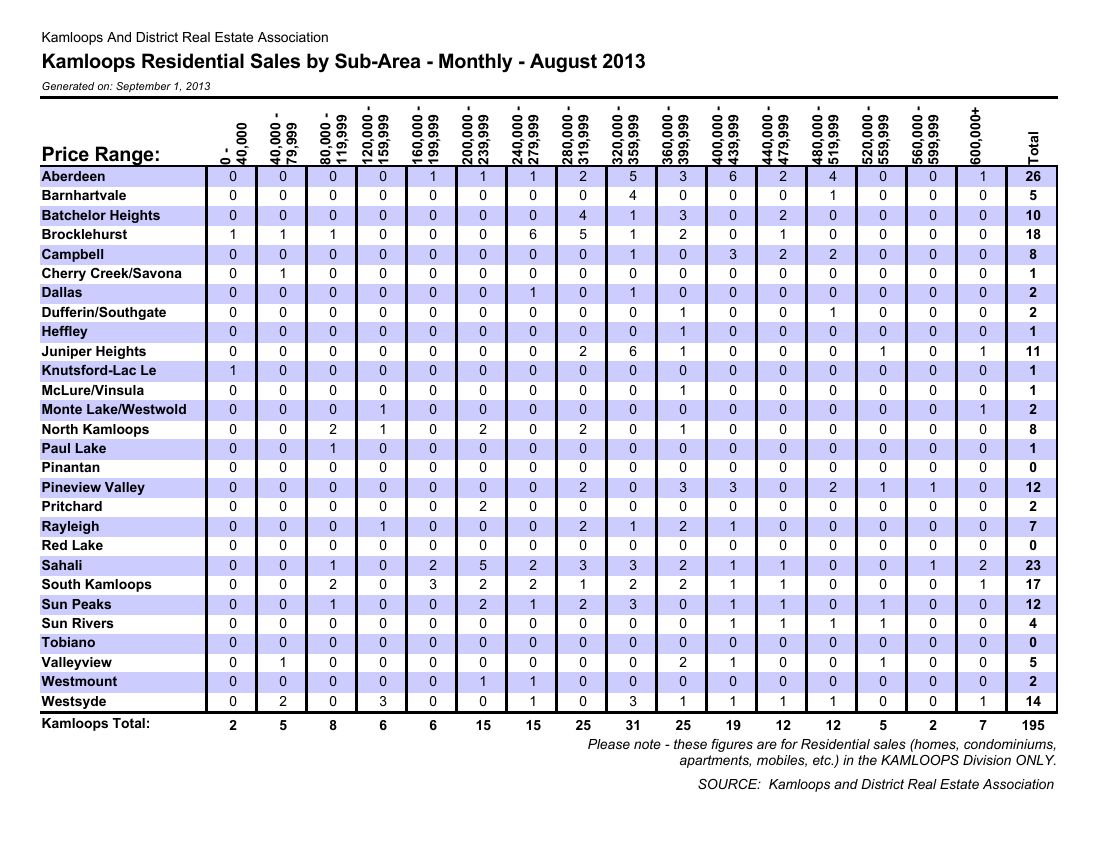
Kamloops Real Estate Sales by subarea September 2013
Kamloops Real Estate Sales by subarea Third 3rd Quarter 2013
Vancouver, BC – September 16, 2013. The British Columbia Real Estate Association (BCREA) reports that a total of 6,863 residential sales were recorded by the Multiple Listing Service® (MLS®) in BC during August, up 28.6 per cent from August 2012. Total sales dollar volume was 39.7 per cent higher than a year ago at $3.66 billion. The average MLS® residential price in the province was $533,400, up 8.6 per cent from August 2012.
Click to enlarge
“After sitting on the sidelines for much of 2012, home buyers were out in force during the summer months,” said Cameron Muir, BCREA Chief Economist. “Fear of a housing market hard landing has given way to a sense of urgency to lock-in a mortgage at a low interest rate.”
While higher mortgage interest rates are on the horizon, BCREA forecasts the five-year posted mortgage rate to be 50 basis points higher a year from now. The impact on consumer demand is expected to be largely offset by stronger economic conditions and the associated employment growth.
Year-to-date, BC residential sales dollar volume was up 1.5 per cent to $26.5 billion, compared to the same period last year. Residential unit sales were down 0.6 per cent to 49,849 units, while the average MLS® residential price was up 2 per cent at $532,130.