Vancouver, BC – January 13, 2017. The British Columbia Real Estate Association (BCREA) reports that a record 112,209 residential unit sales were recorded by the Multiple Listing Service® (MLS®) in 2016, an increase of 9.5 per cent from the previous year. Total sales dollar volume was a record $77.6 billion, up 18.8 per cent from 2015. The average MLS® residential price in the province climbed 8.6 per cent to $691,144 on an annual basis in 2016.
“Broad-based consumer demand driven by strong economic conditions, employment growth, consumer confidence, and an expanding population base pushed home sales to record levels in many BC regions last year,” said Cameron Muir, BCREA Chief Economist. “However, home sales have fallen back from their lofty peaks early last year.” The seasonally adjusted annual rate of sales activity was approximately 92,000 units in December.
A total of 4,721 residential unit sales were recorded by the MLS® in December, down 28.4 per cent from the same month last year. Total sales dollar volume was $3.1 billion last month, a decline of 33.1 per cent compared to the same month the previous year. The average MLS® residential price in the province was $654,699 in December, a 6.6 per cent decline from December 2015.
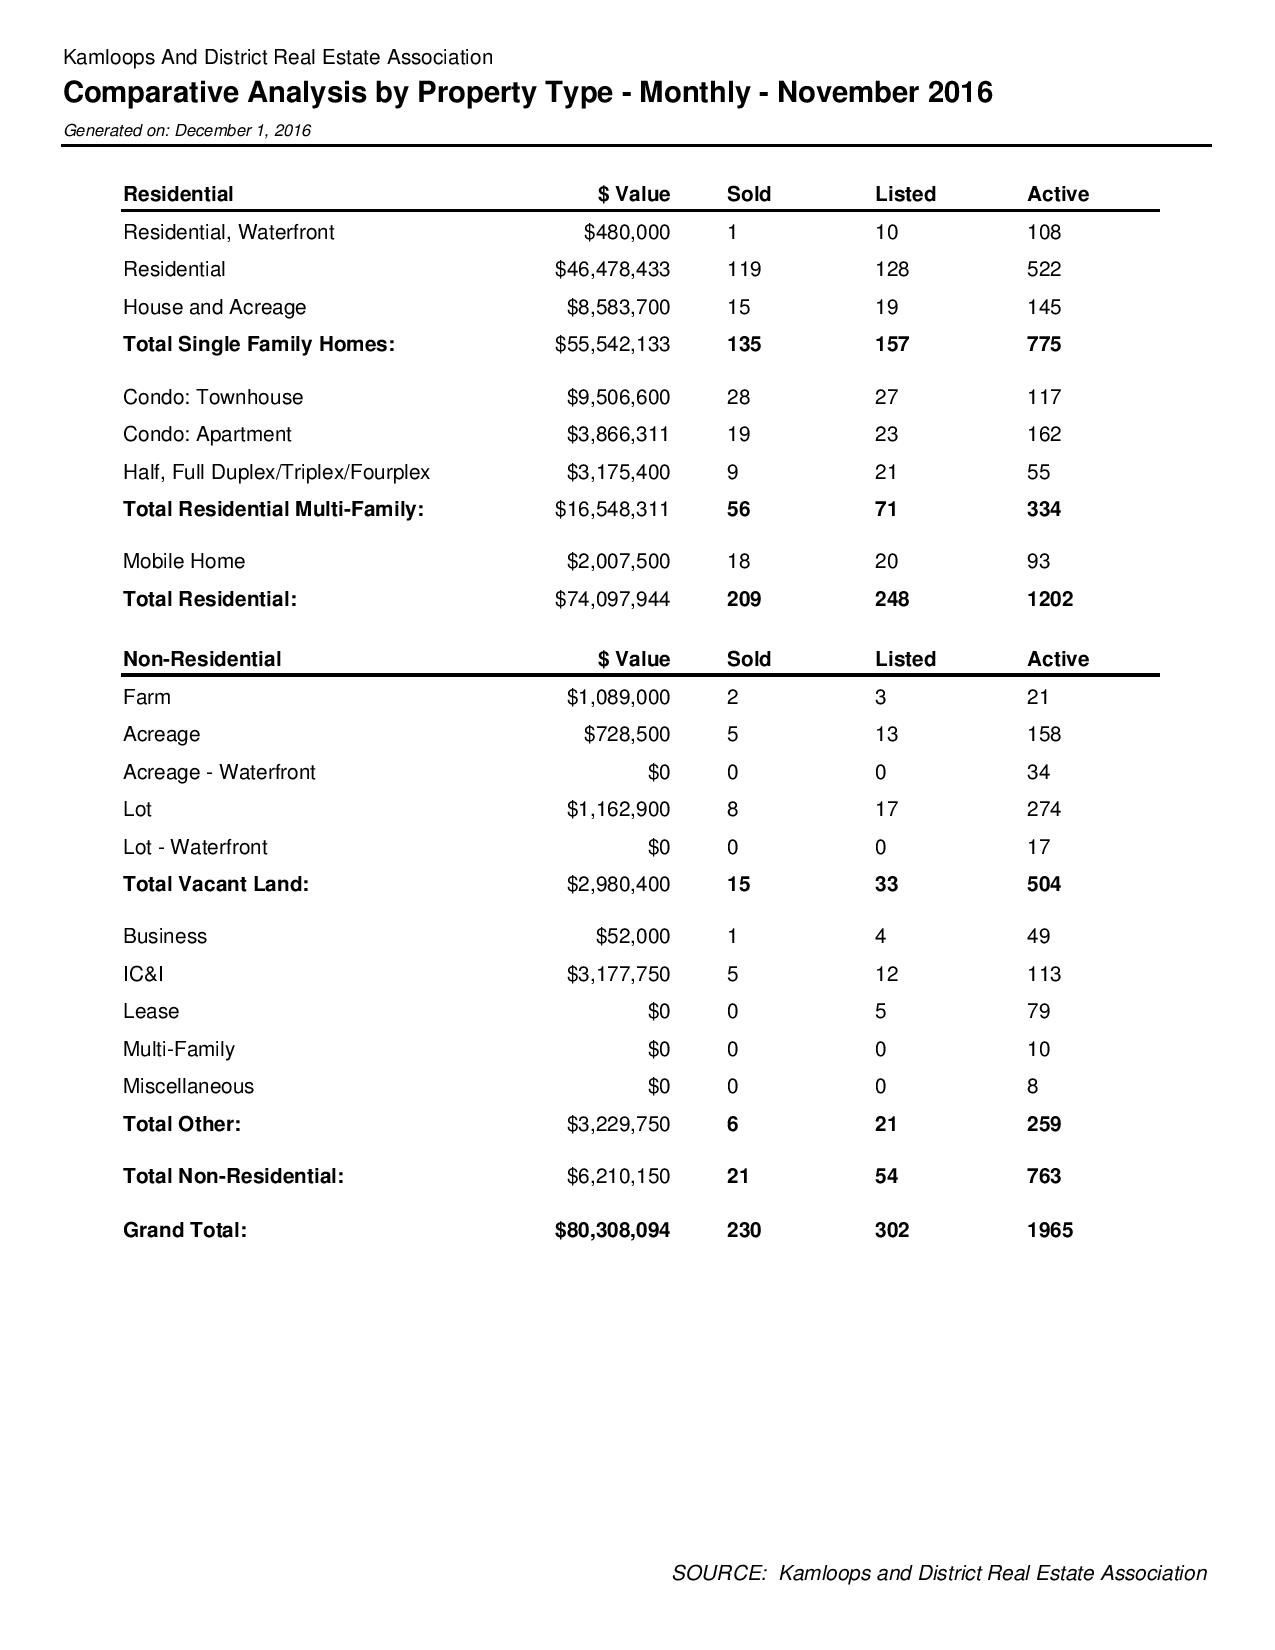
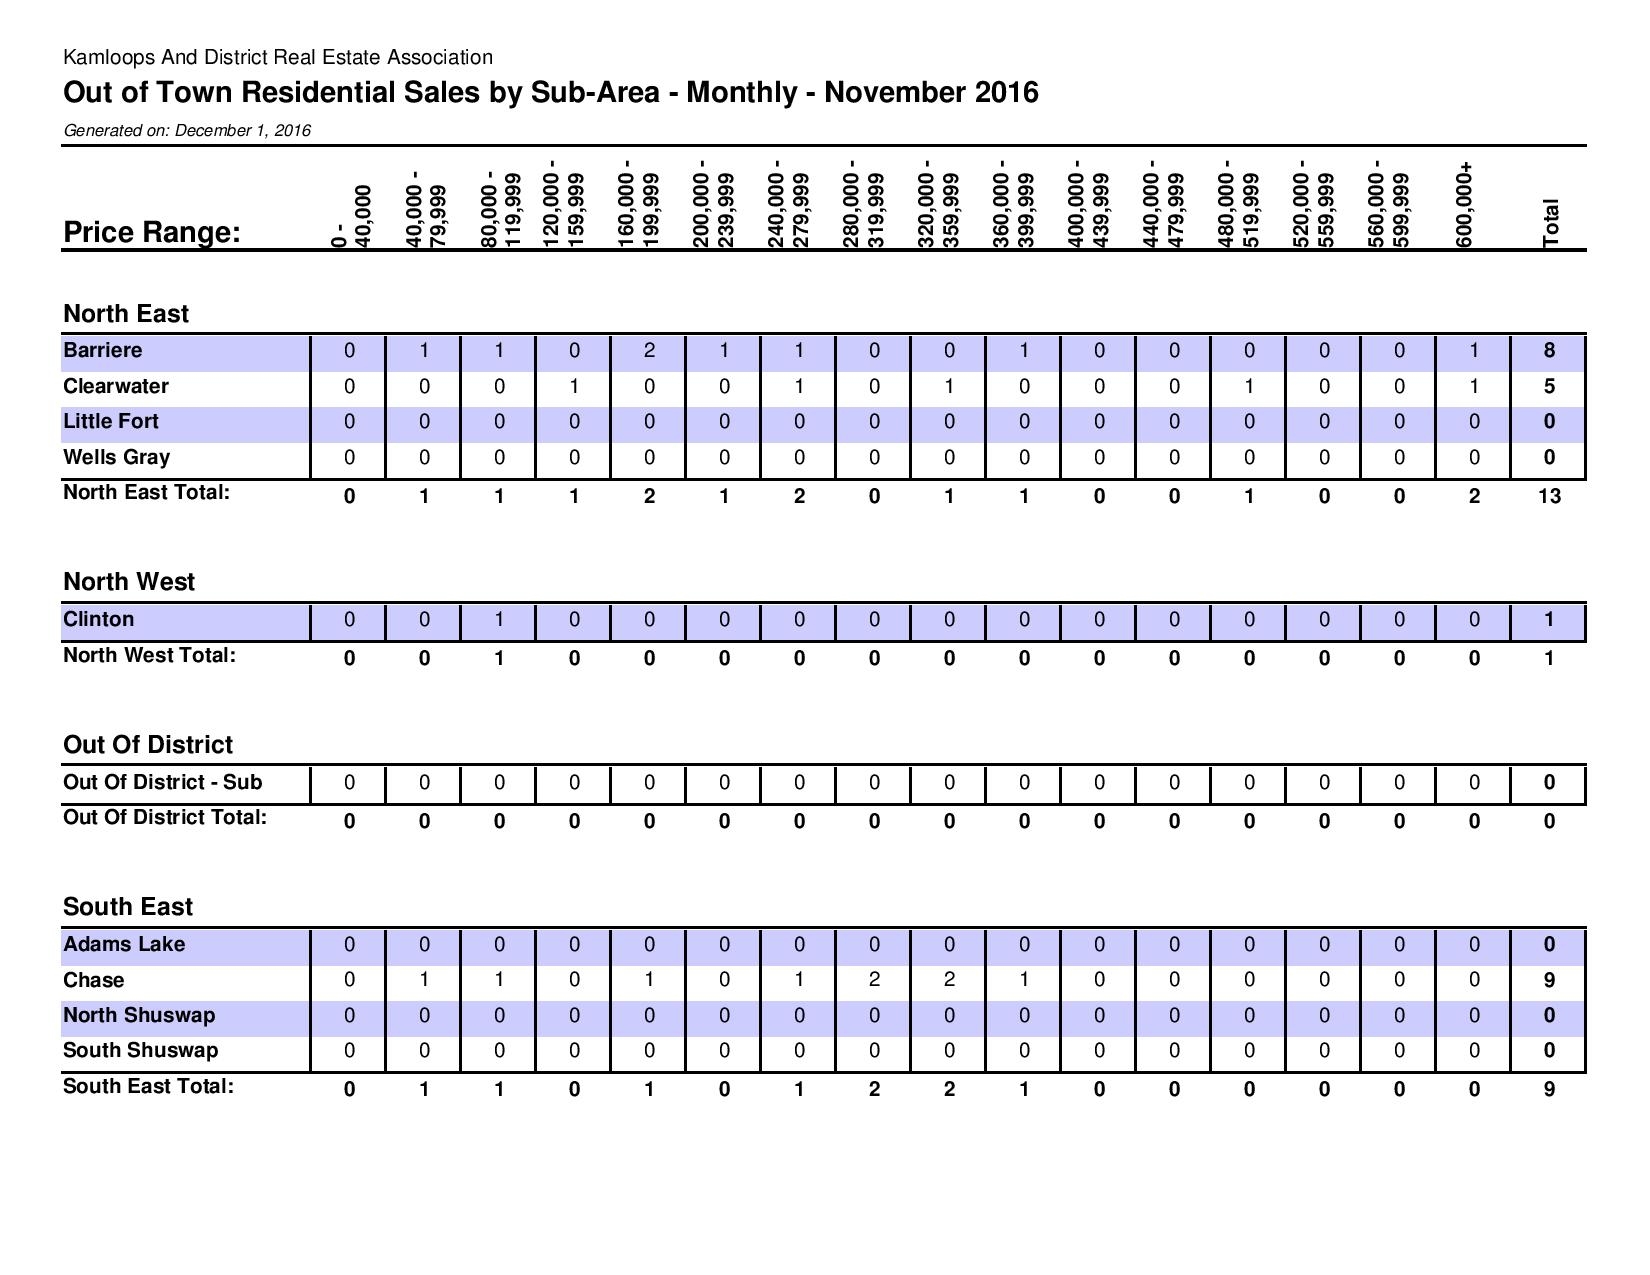
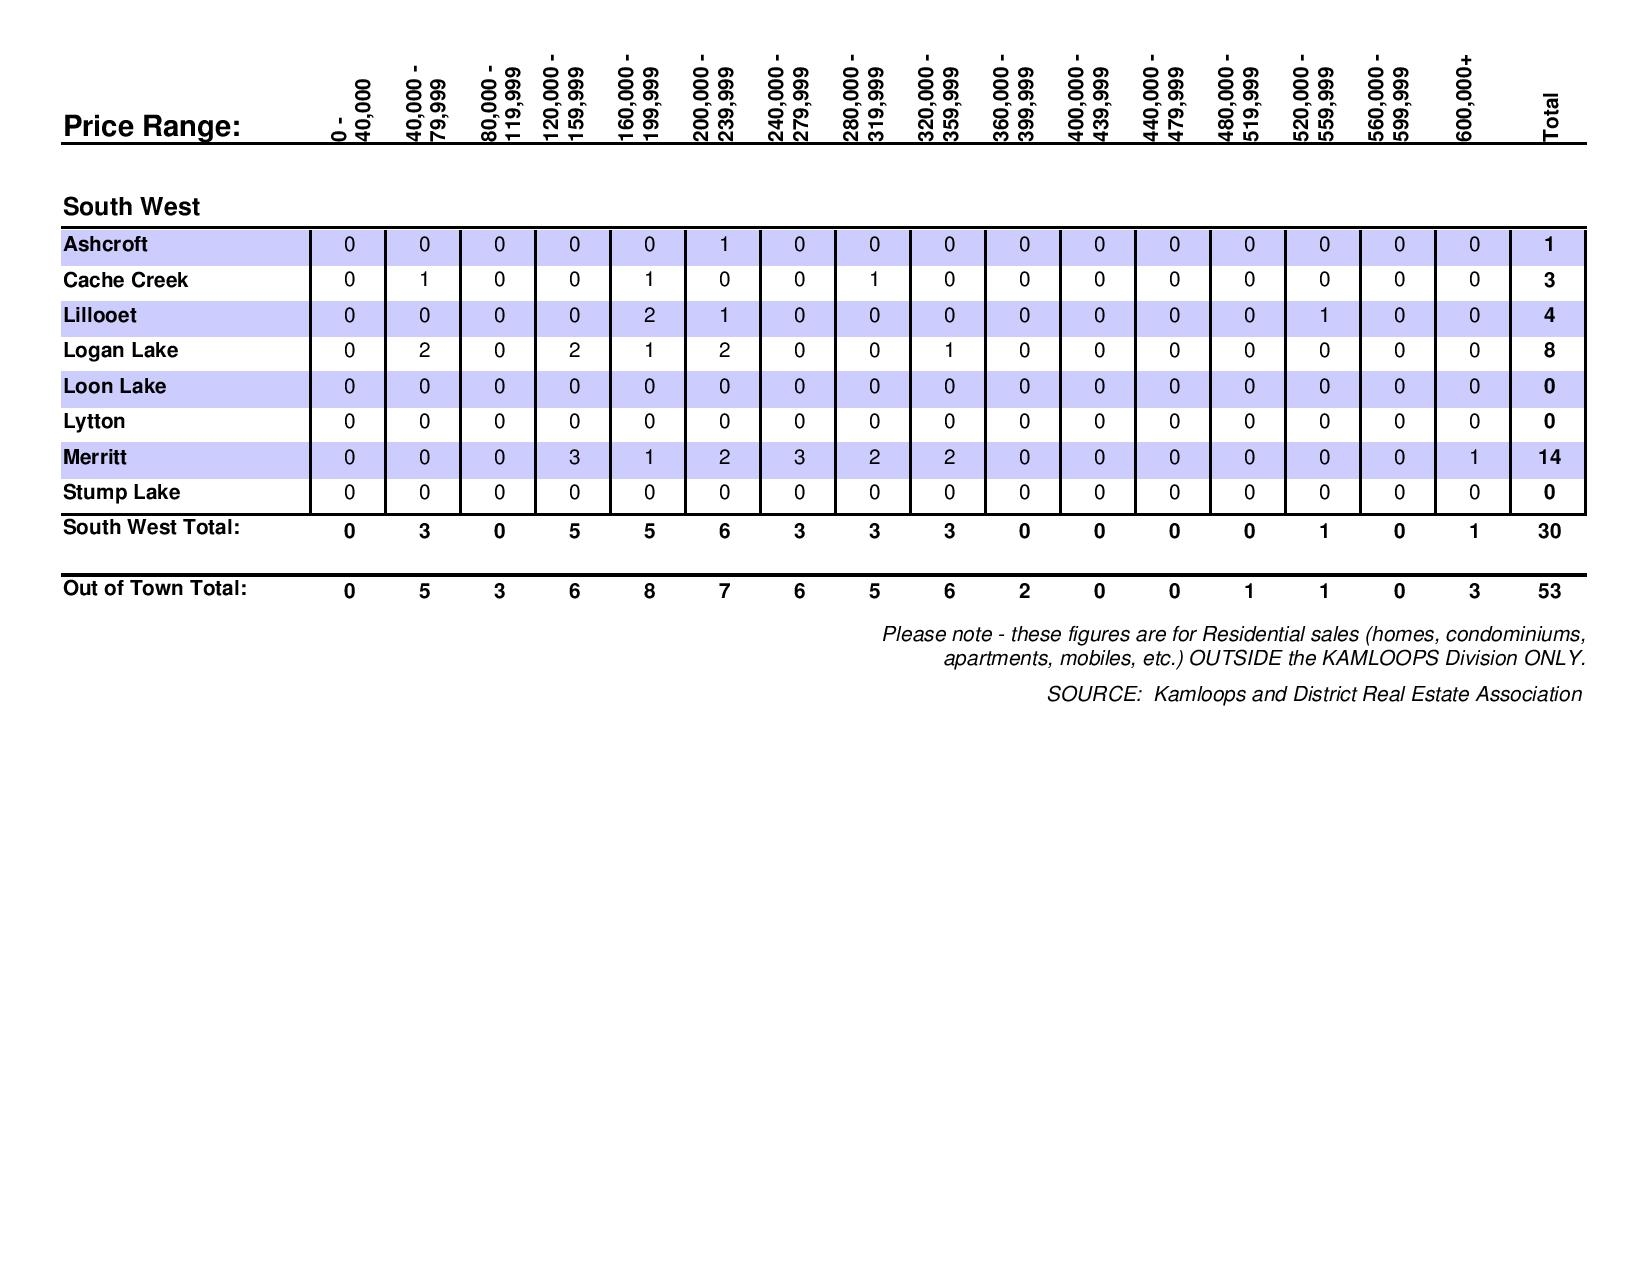
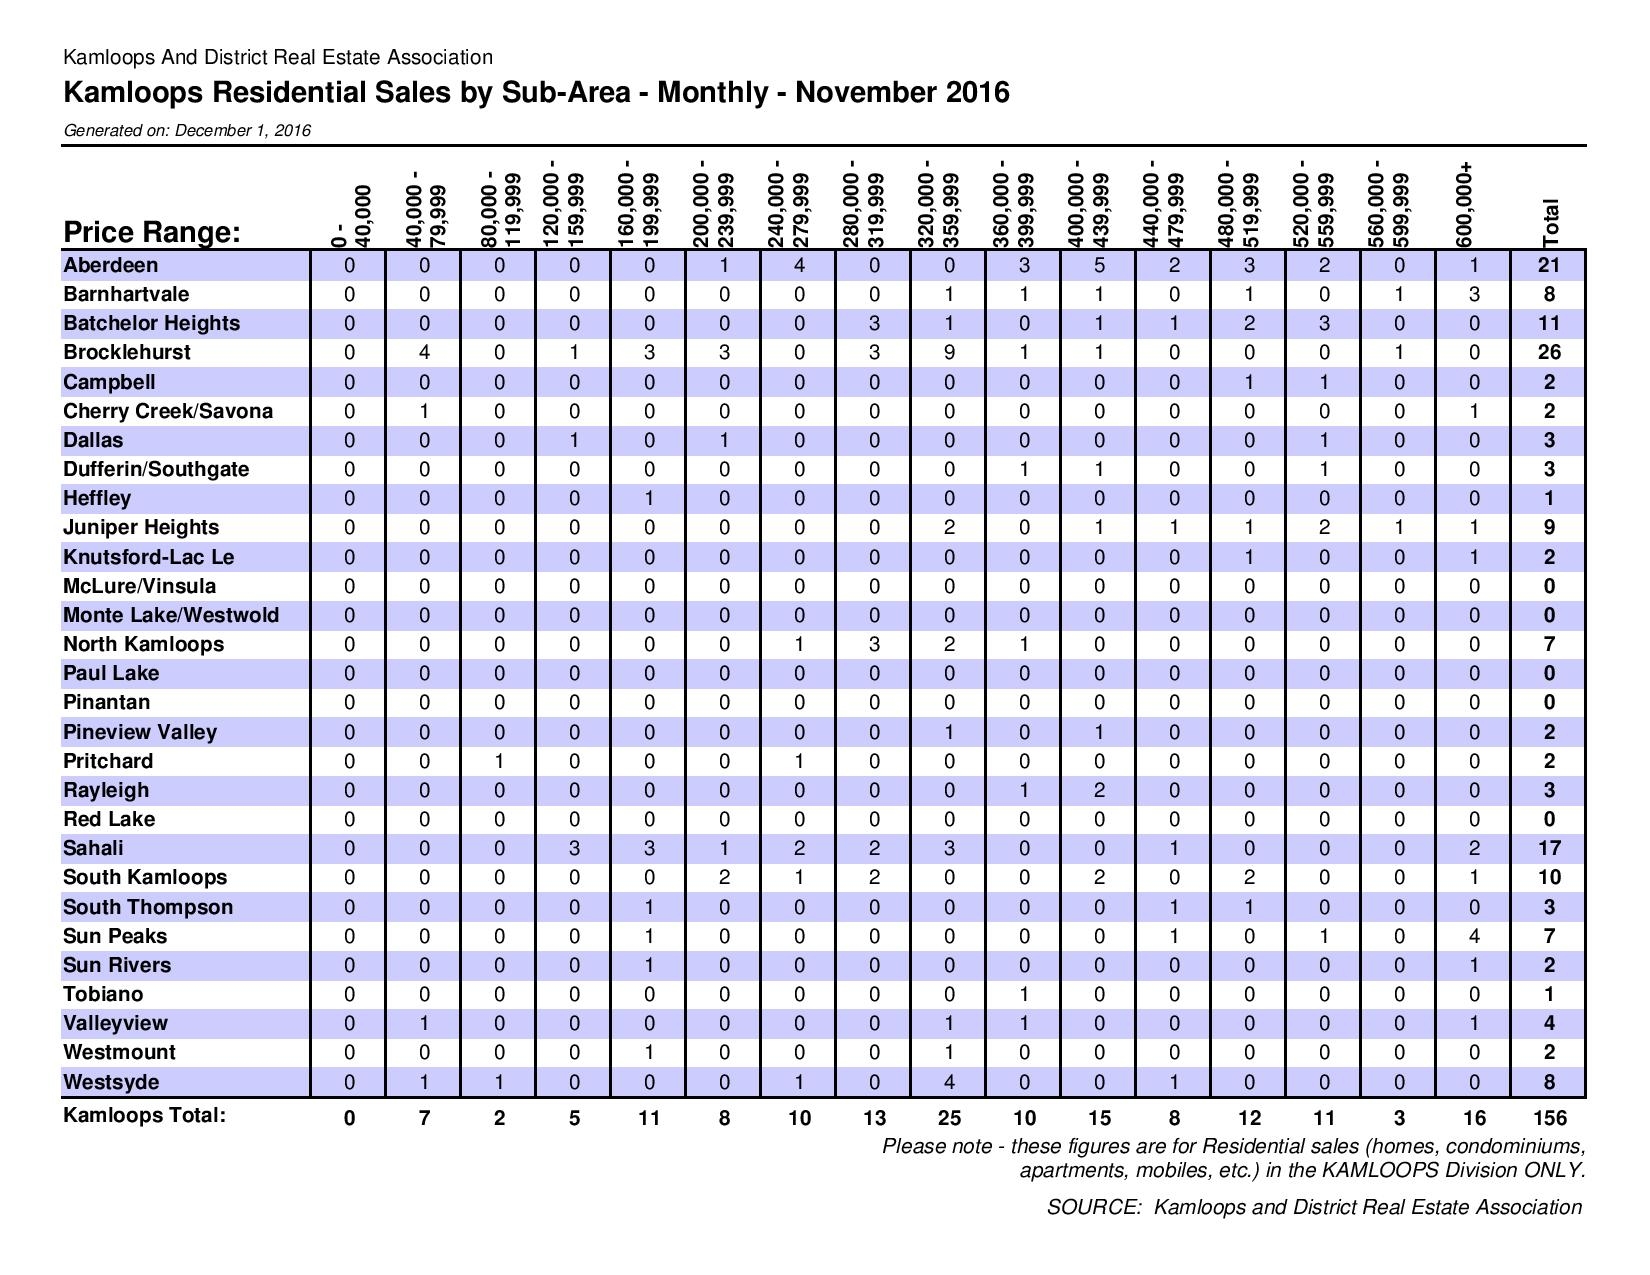
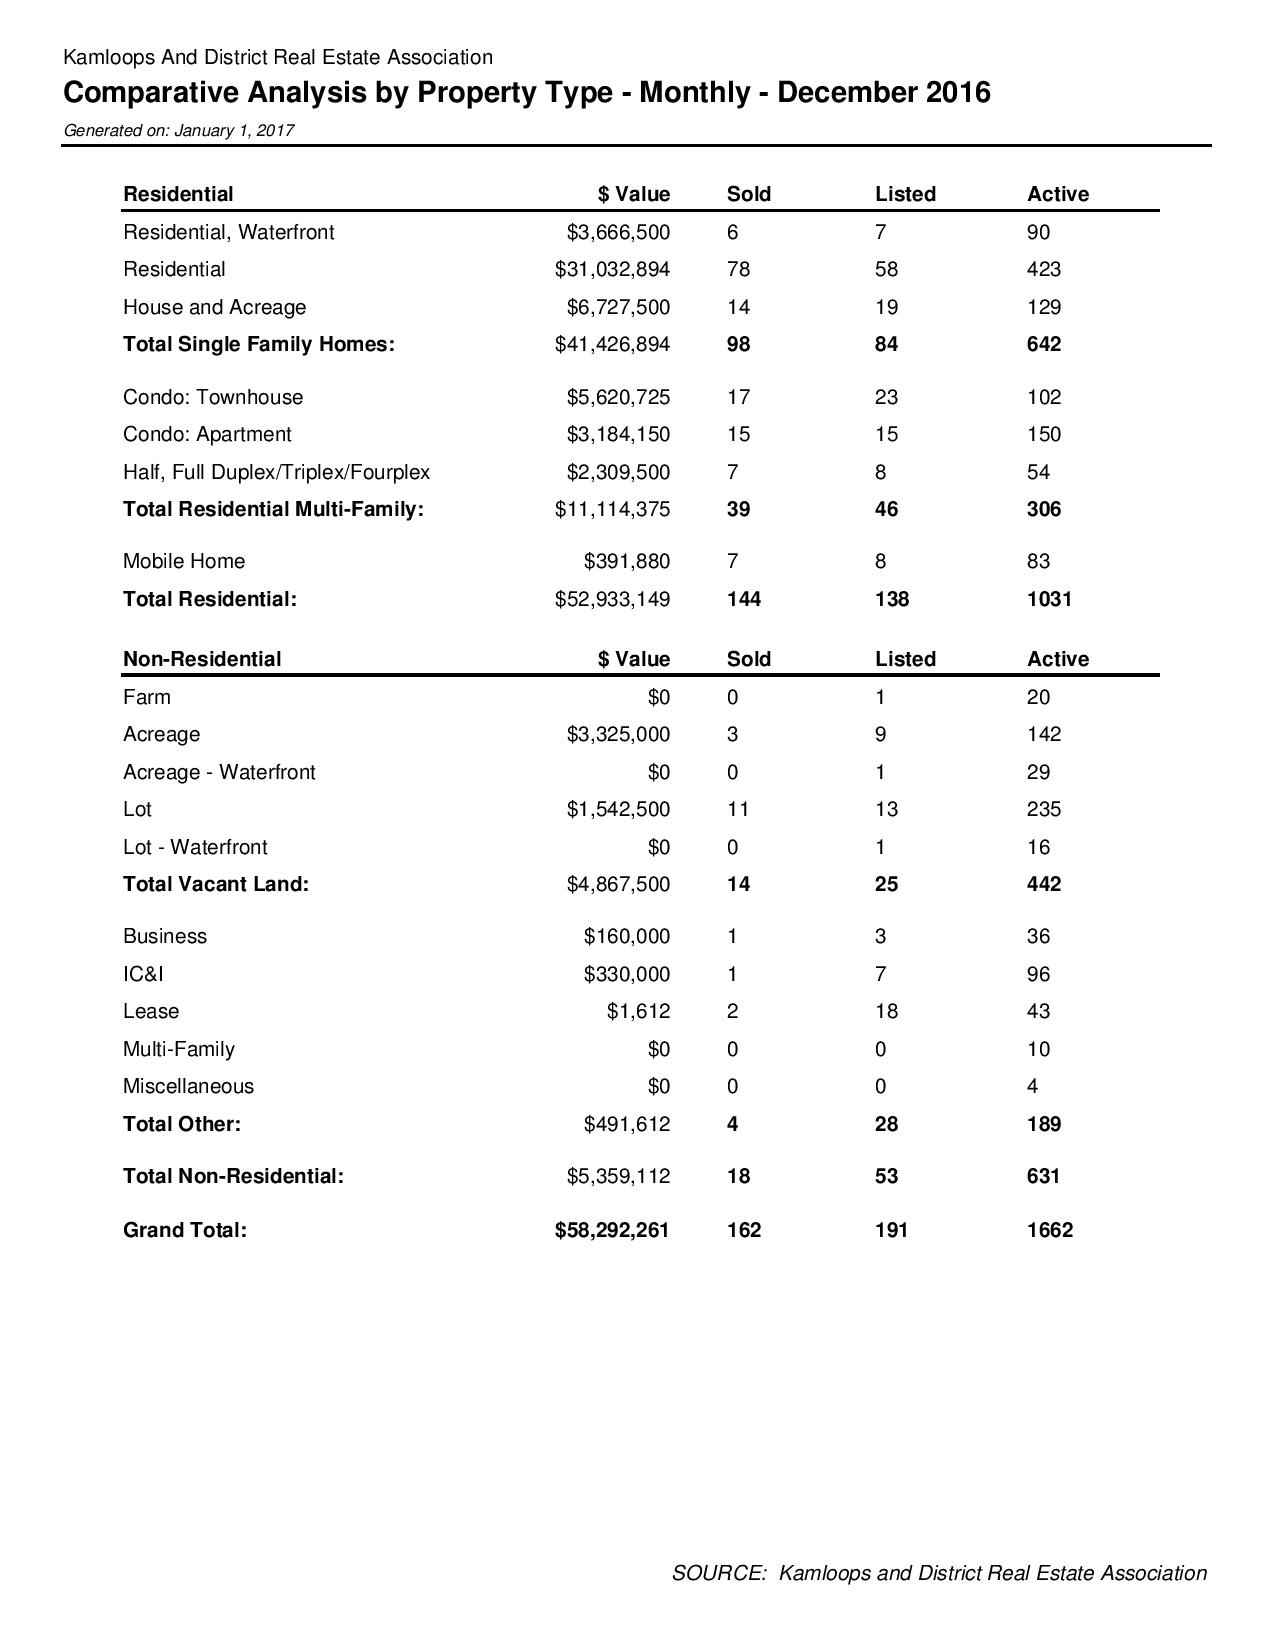
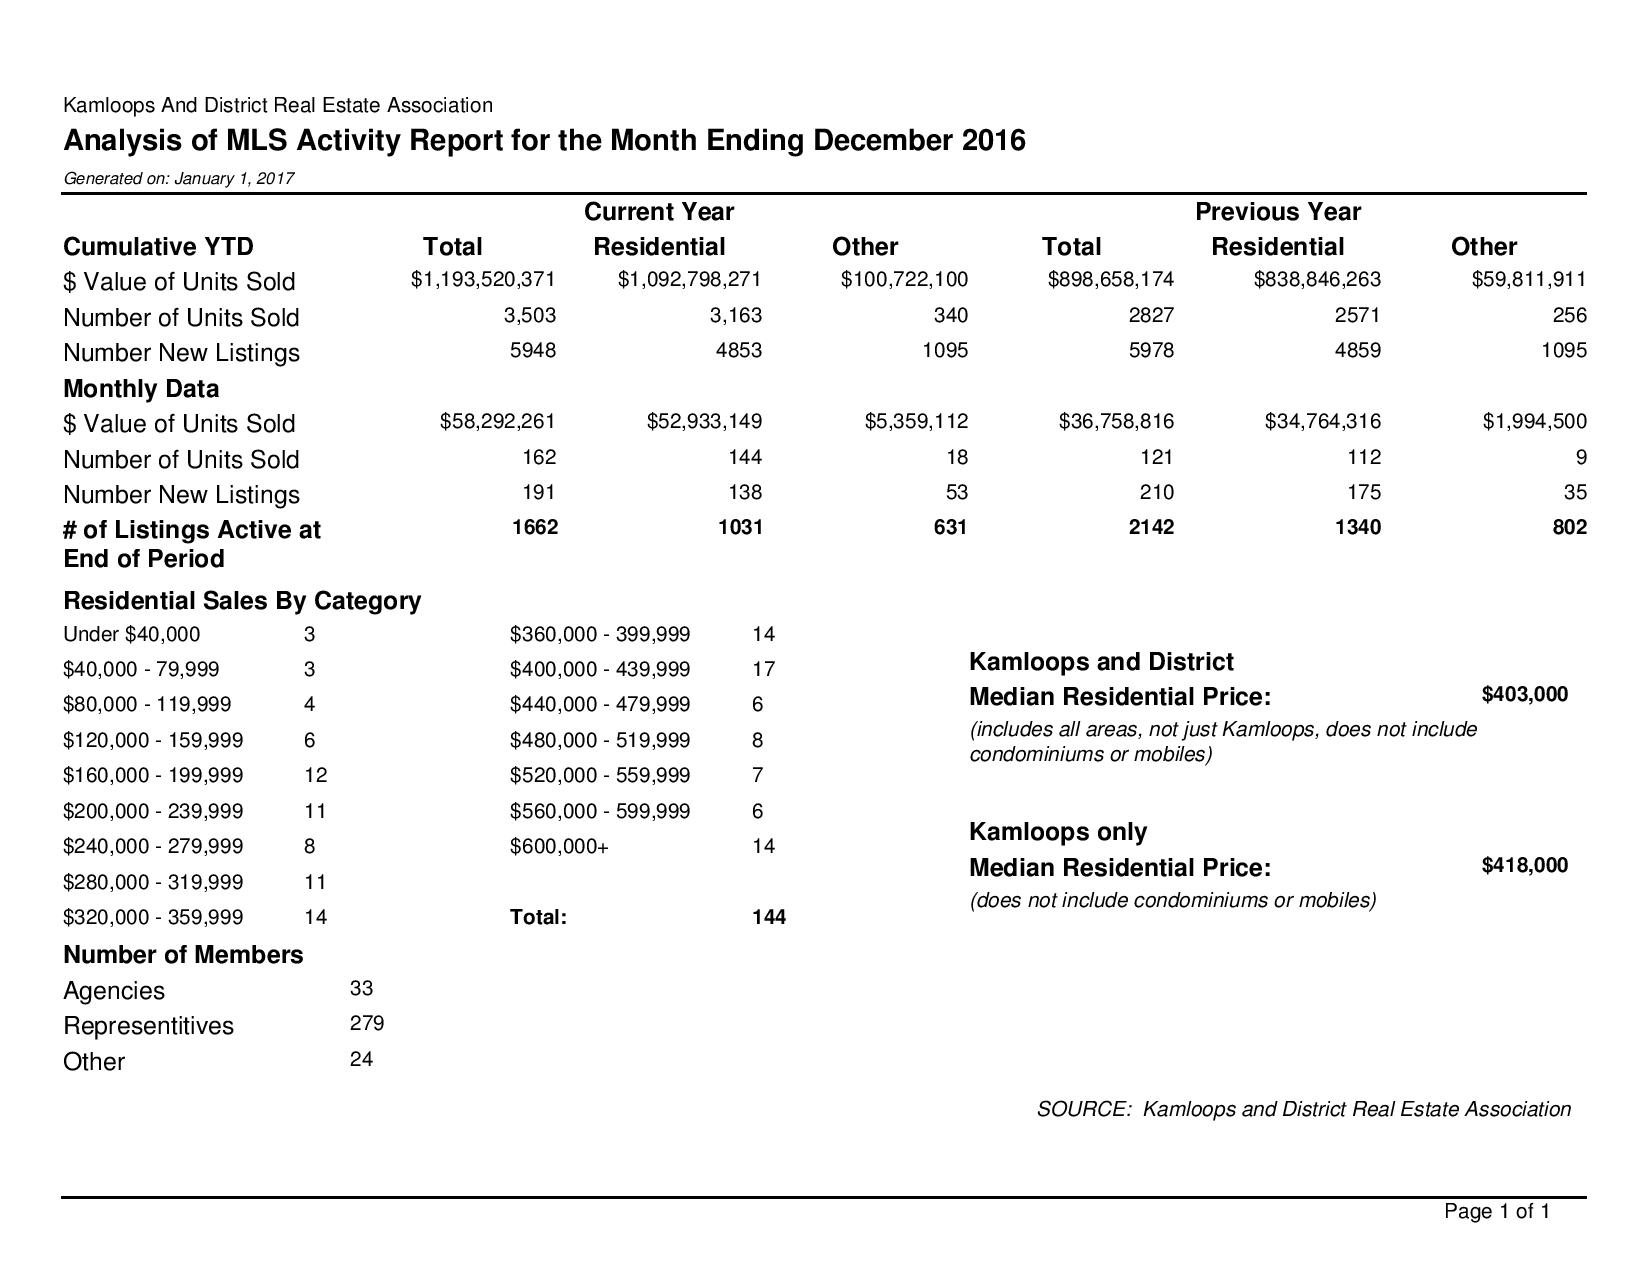
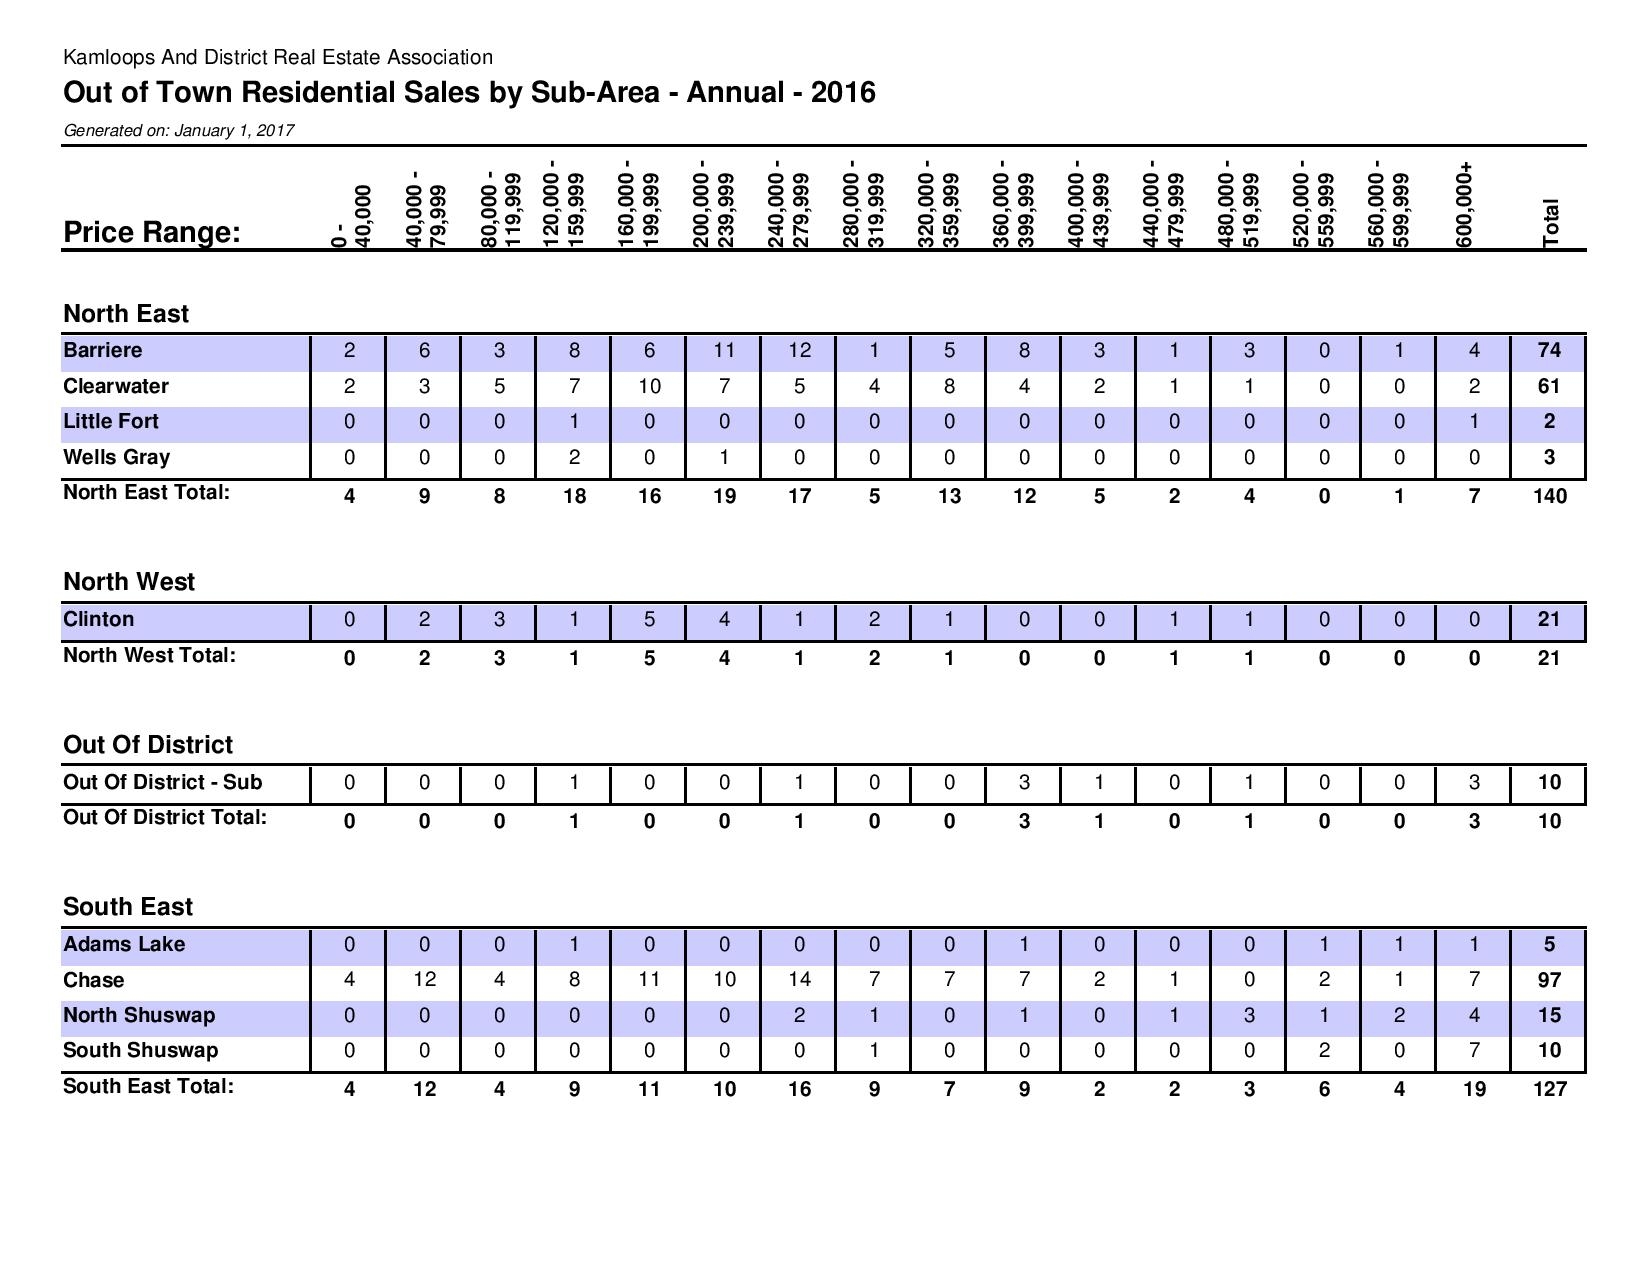
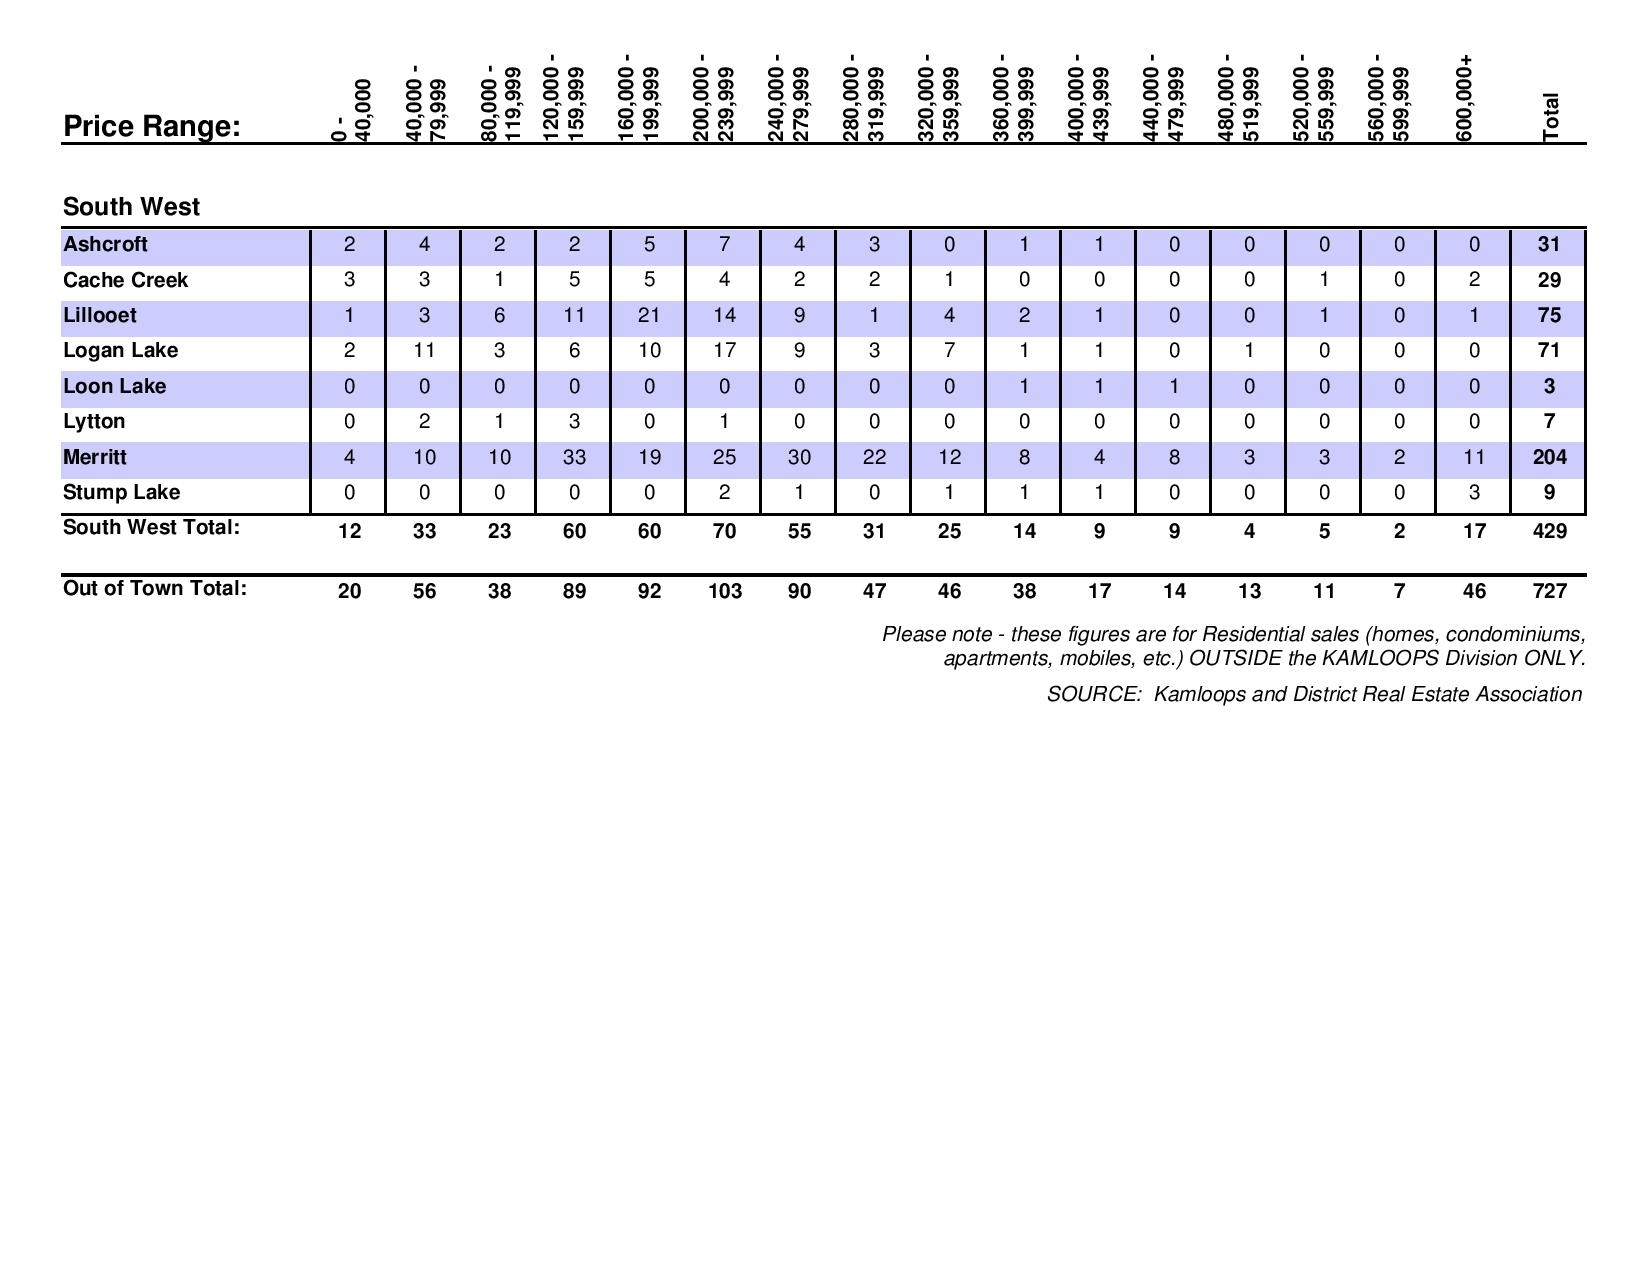
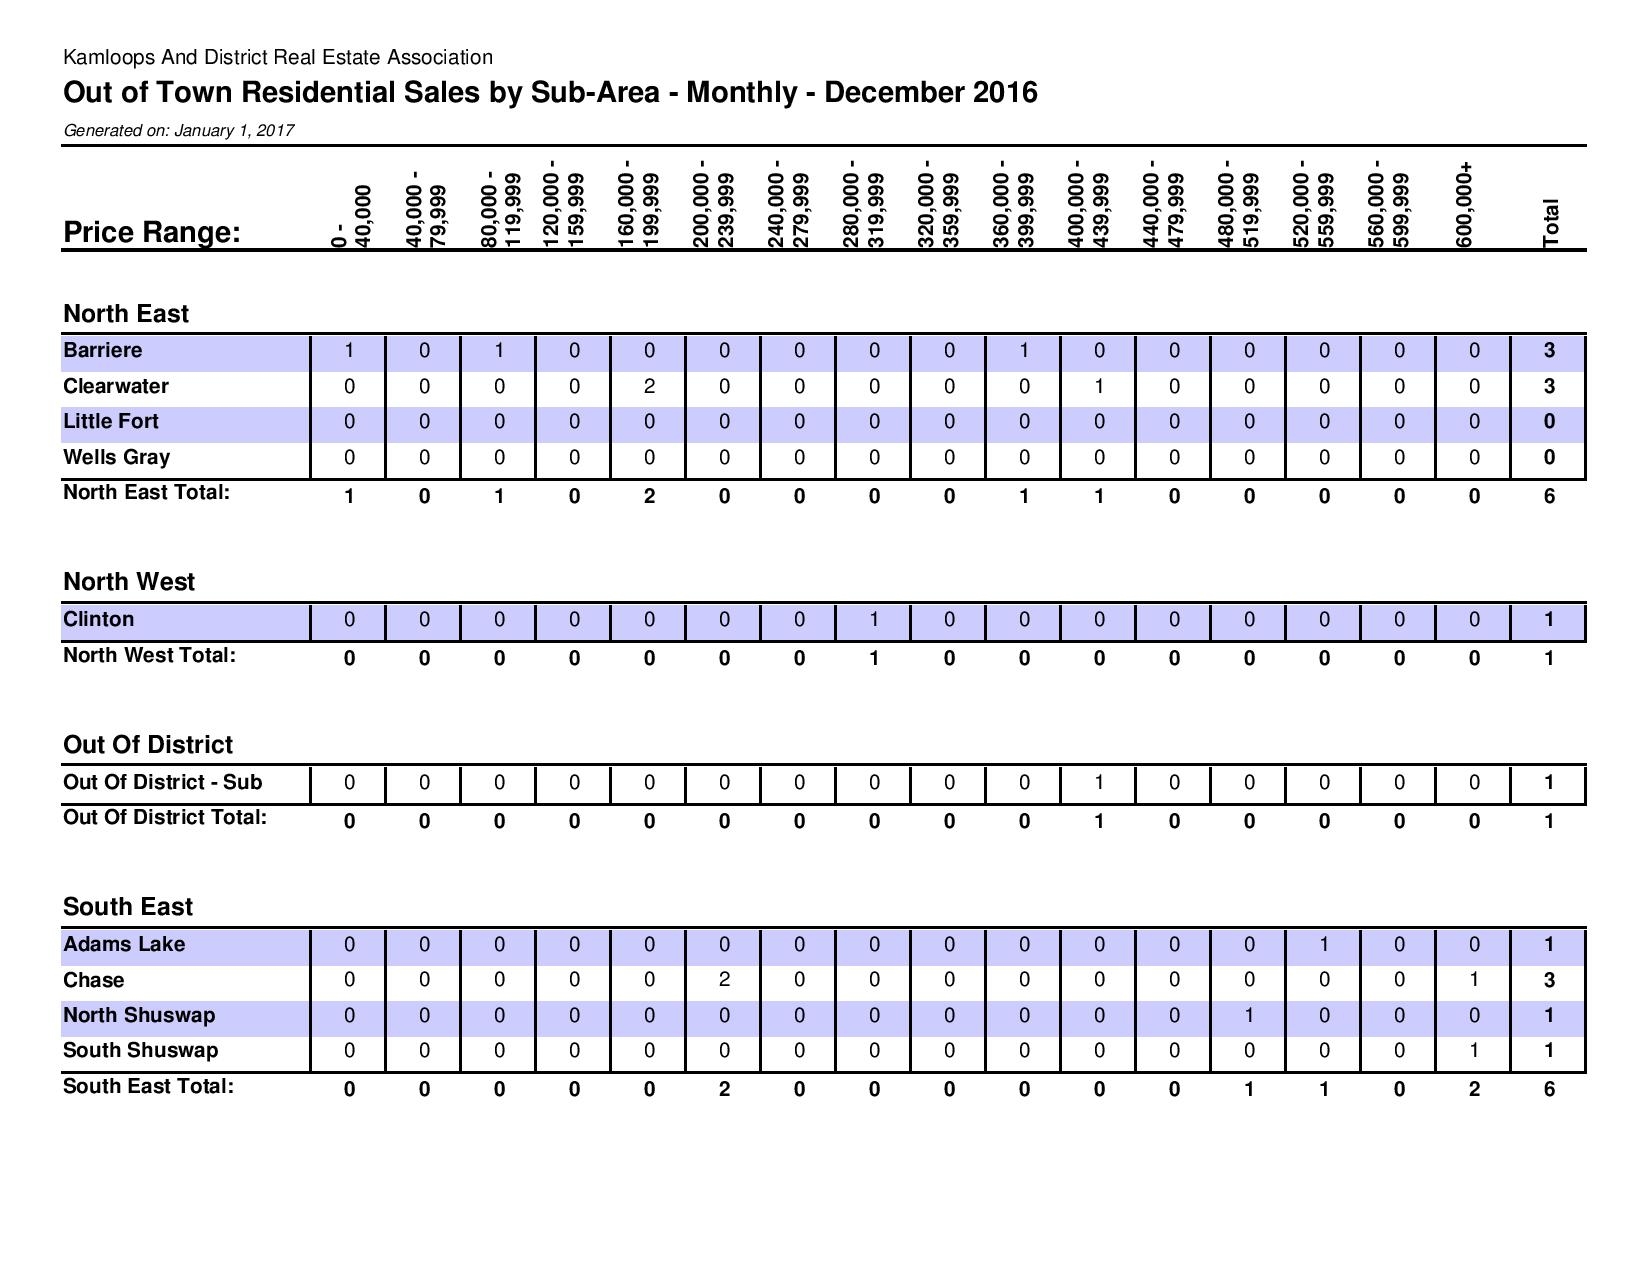
The Kamloops District Real Estate Association has released the latest Statistics For December 2016, 4th Quarter and 2016 Year End. Click on the image below to enlarge or PDF documents included in the links below.
Kamloops Real Estate Comparative analysis by property type Annual Year End 2016
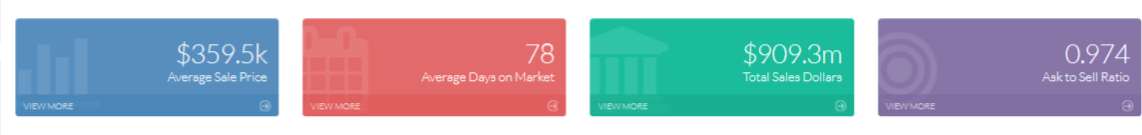
The Kamloops real estate market is starting to heat up even though the weather outside is quite frigid. Here are some interesting statistics I pulled up today. There has been a lot of talk about Kamloops property assessments that recently came out and how they affect your property’s market value. Contact us anytime to chat about that!
There are a lot of buyers out there ready to buy. With listing inventory still low it is a great time to think of getting your home on the market.
In the Aberdeen area, the highest price per square foot of new Single Family type listings within the last 6 months is $361.61.
11.11% of Single Family type properties listed in the Batchelor Heights area,within the last 2 months have actually sold.
The average sale price of Single Family type listings in the Cherry Creek/Savona area, within the last 6 months is $413,600.00.
The highest list to sell ratio of Single Family type listings in the Dallas area, within the last 5 months is 0.992.
The highest sale price of Single Family type listings in the Dufferin/Southgate area, within the last 6 months is $522,000.00.
In the Heffley area, the average home price per square foot of new Single Family type listings within the last year is $304.02.
The average list to sell ratio of Single Family type listings in the Juniper Heights area, within the last 5 months is 0.980.
The average sale price of Single Family type listings in the North Kamloops area, within the last 11 months is $304,250.00.
The average sale price of Single Family type listings in the Pritchard area, within the last 9 months is $416,081.82.
The average sale price of Single Family type listings in the Rayleigh area, within the last 3 months is $423,250.00.
In the Sahali area, the average home price per square foot of new Townhouse type listings within the last 8 months is $179.52.
In the South Kamloops area, the average home price per square foot of new Townhouse type listings within the last 6 months is $220.72.
The average sale price of Townhouse type listings in the South Kamloops area, within the last 2 months is $282,000.00.
The average sale price of Townhouse type listings in the Sun Peaks area, within the last year is $491,243.10.
The average list to sell ratio of Townhouse type listings in the Sun Peaks area, within the last 5 months is 0.990.
The average list to sell ratio of Single Family type listings in the Sun Rivers area, within the last 3 months is 0.996.
The average list to sell ratio of Single Family type listings in the South Thompson Valley area, within the last 5 months is 0.975.
The average list to sell ratio of Single Family type listings in the Valleyview area, within the last 4 months is 0.973.
In the Valleyview area, the average home square footage of new Single Family type listings within the last 5 months is 2708.46 sq ft.
60.00% of Townhouse type properties listed in the Westmount area,within the last 11 months have actually sold.
Kirsten Mason Team Sales Statistics:
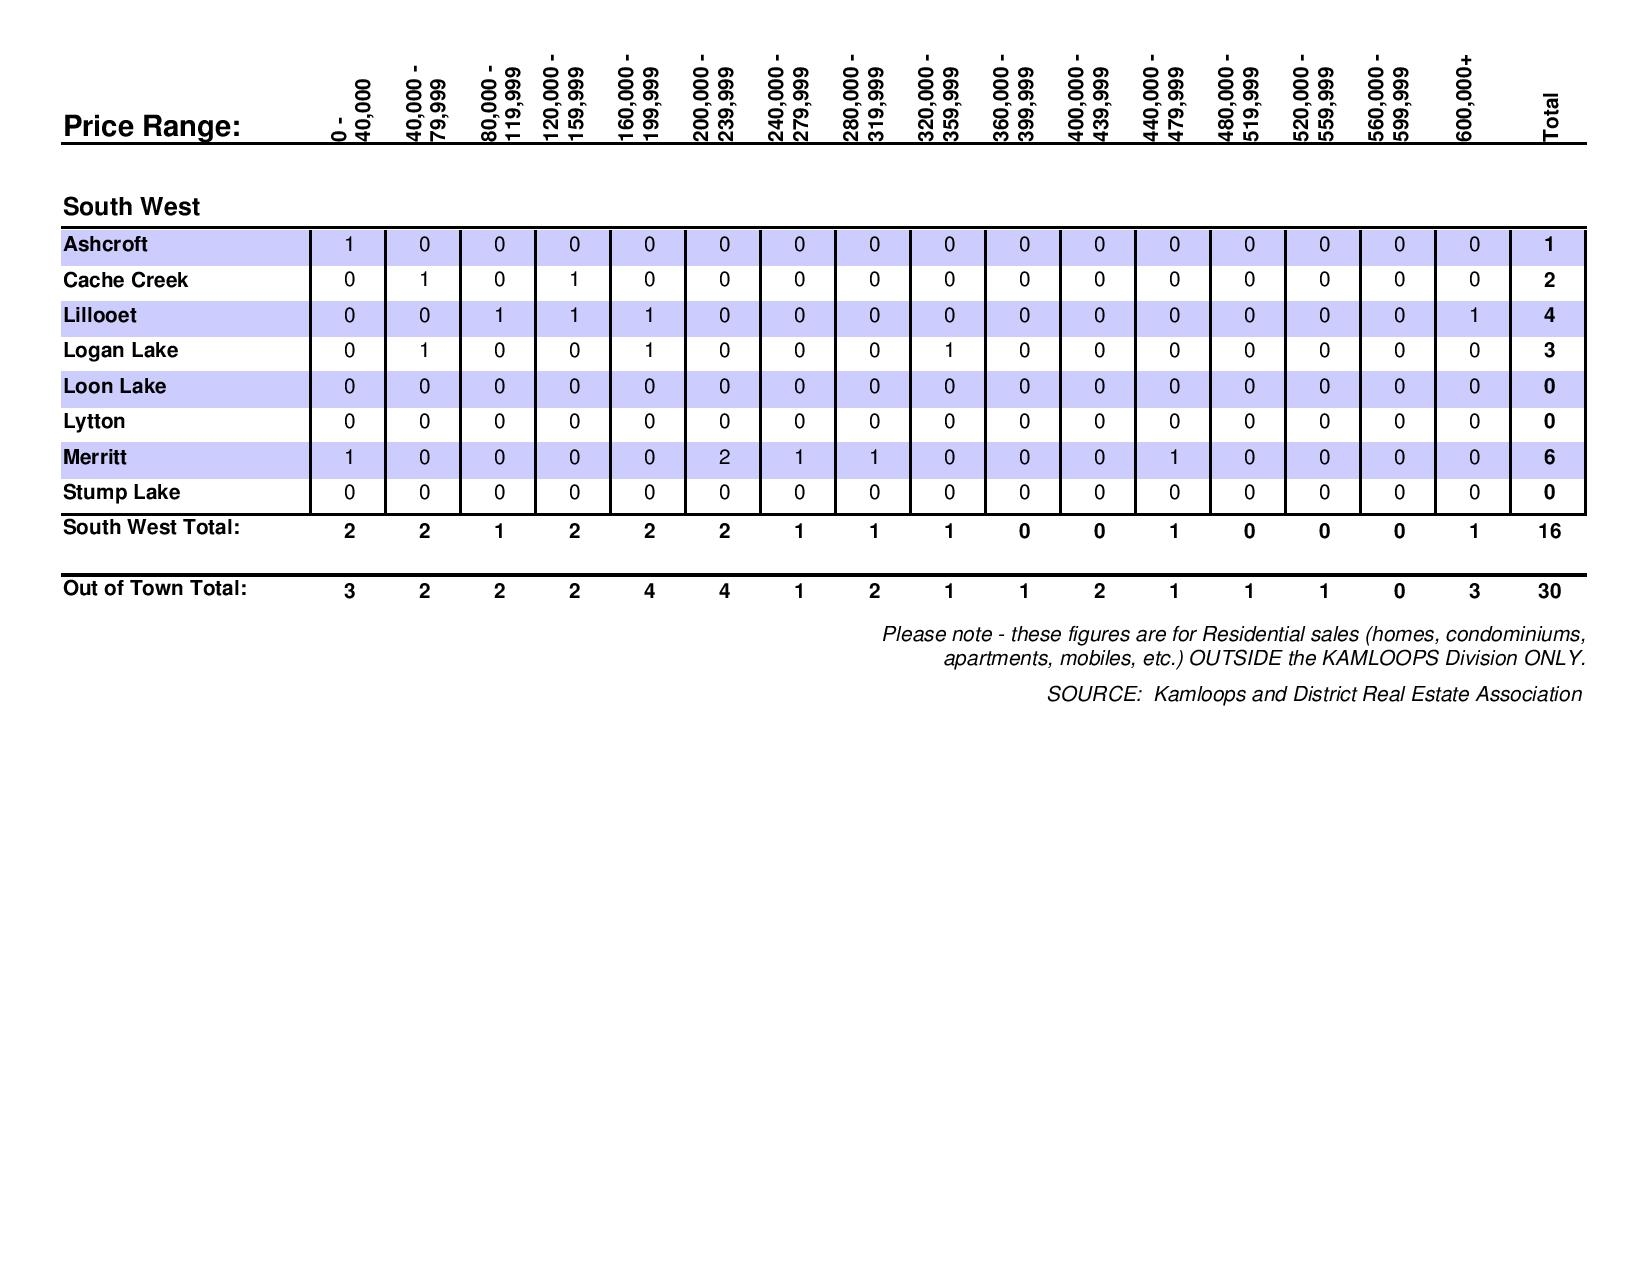
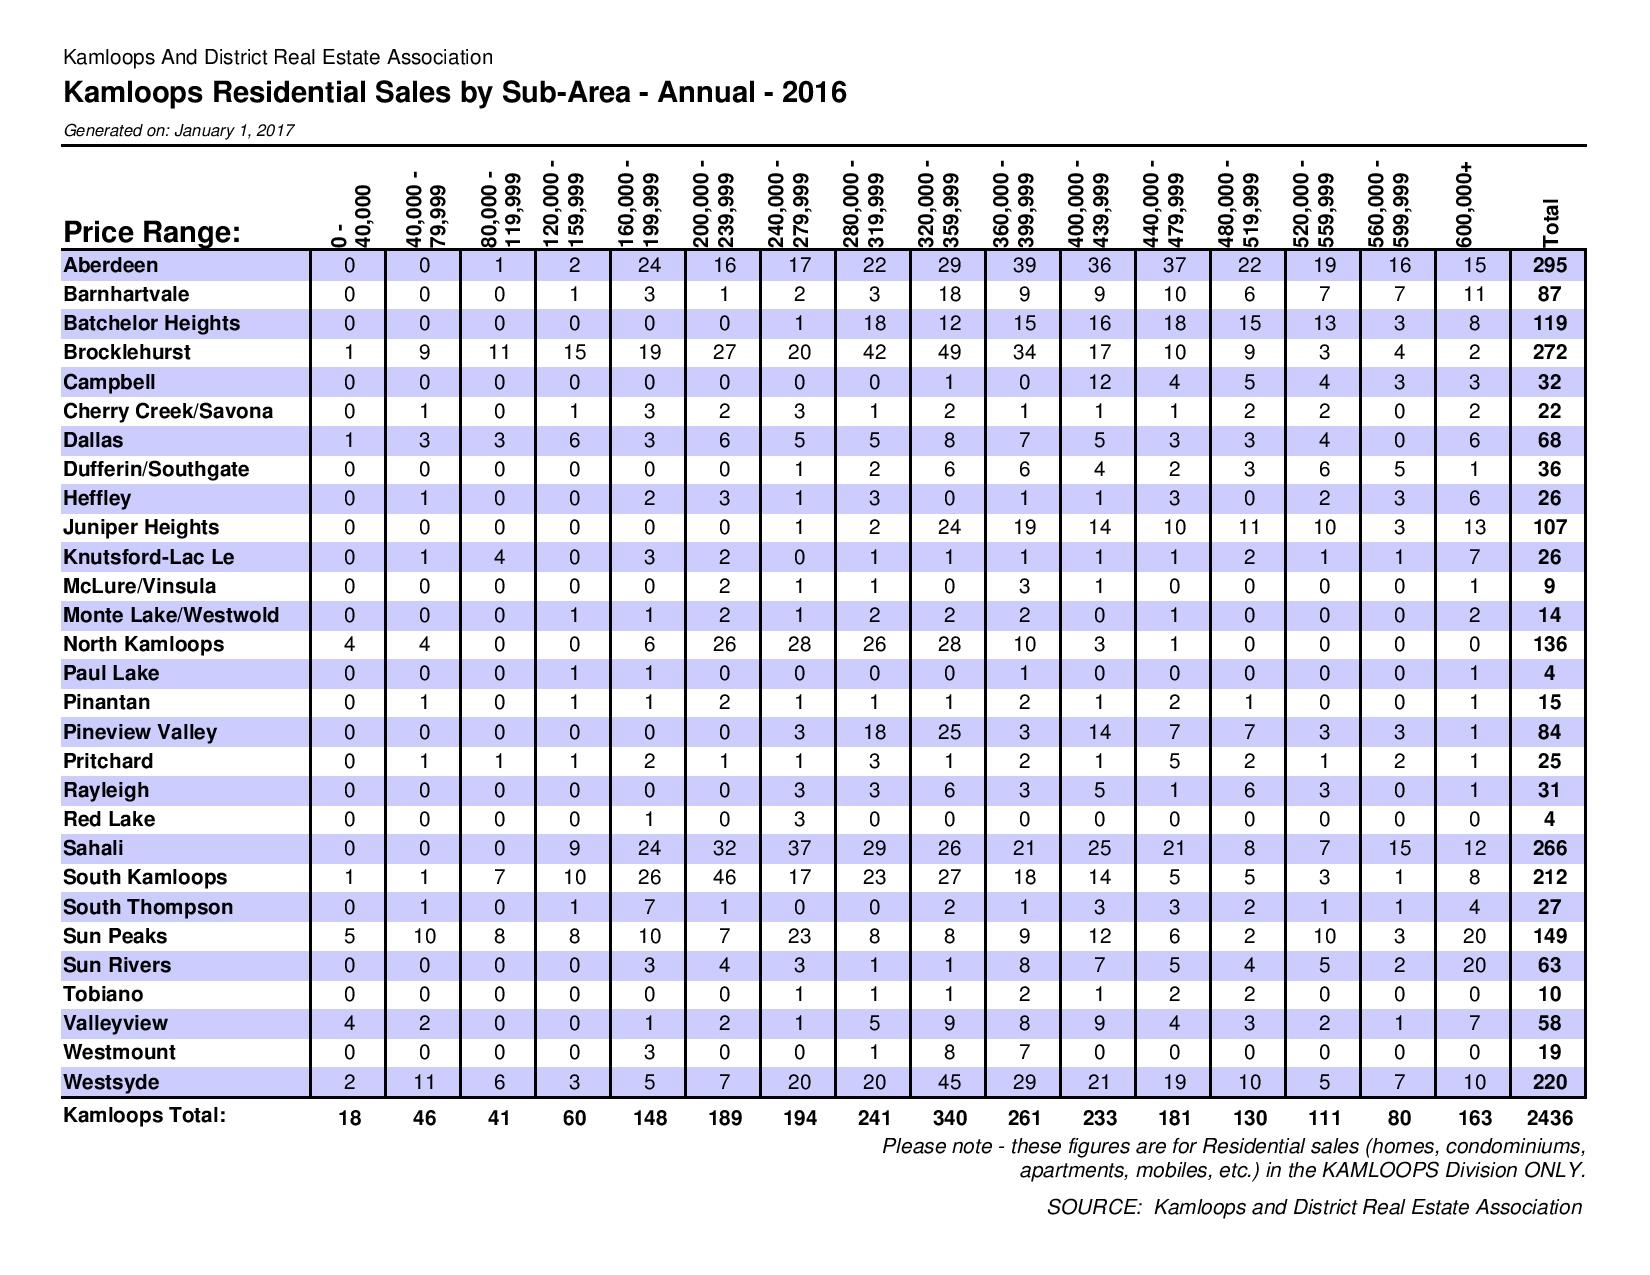
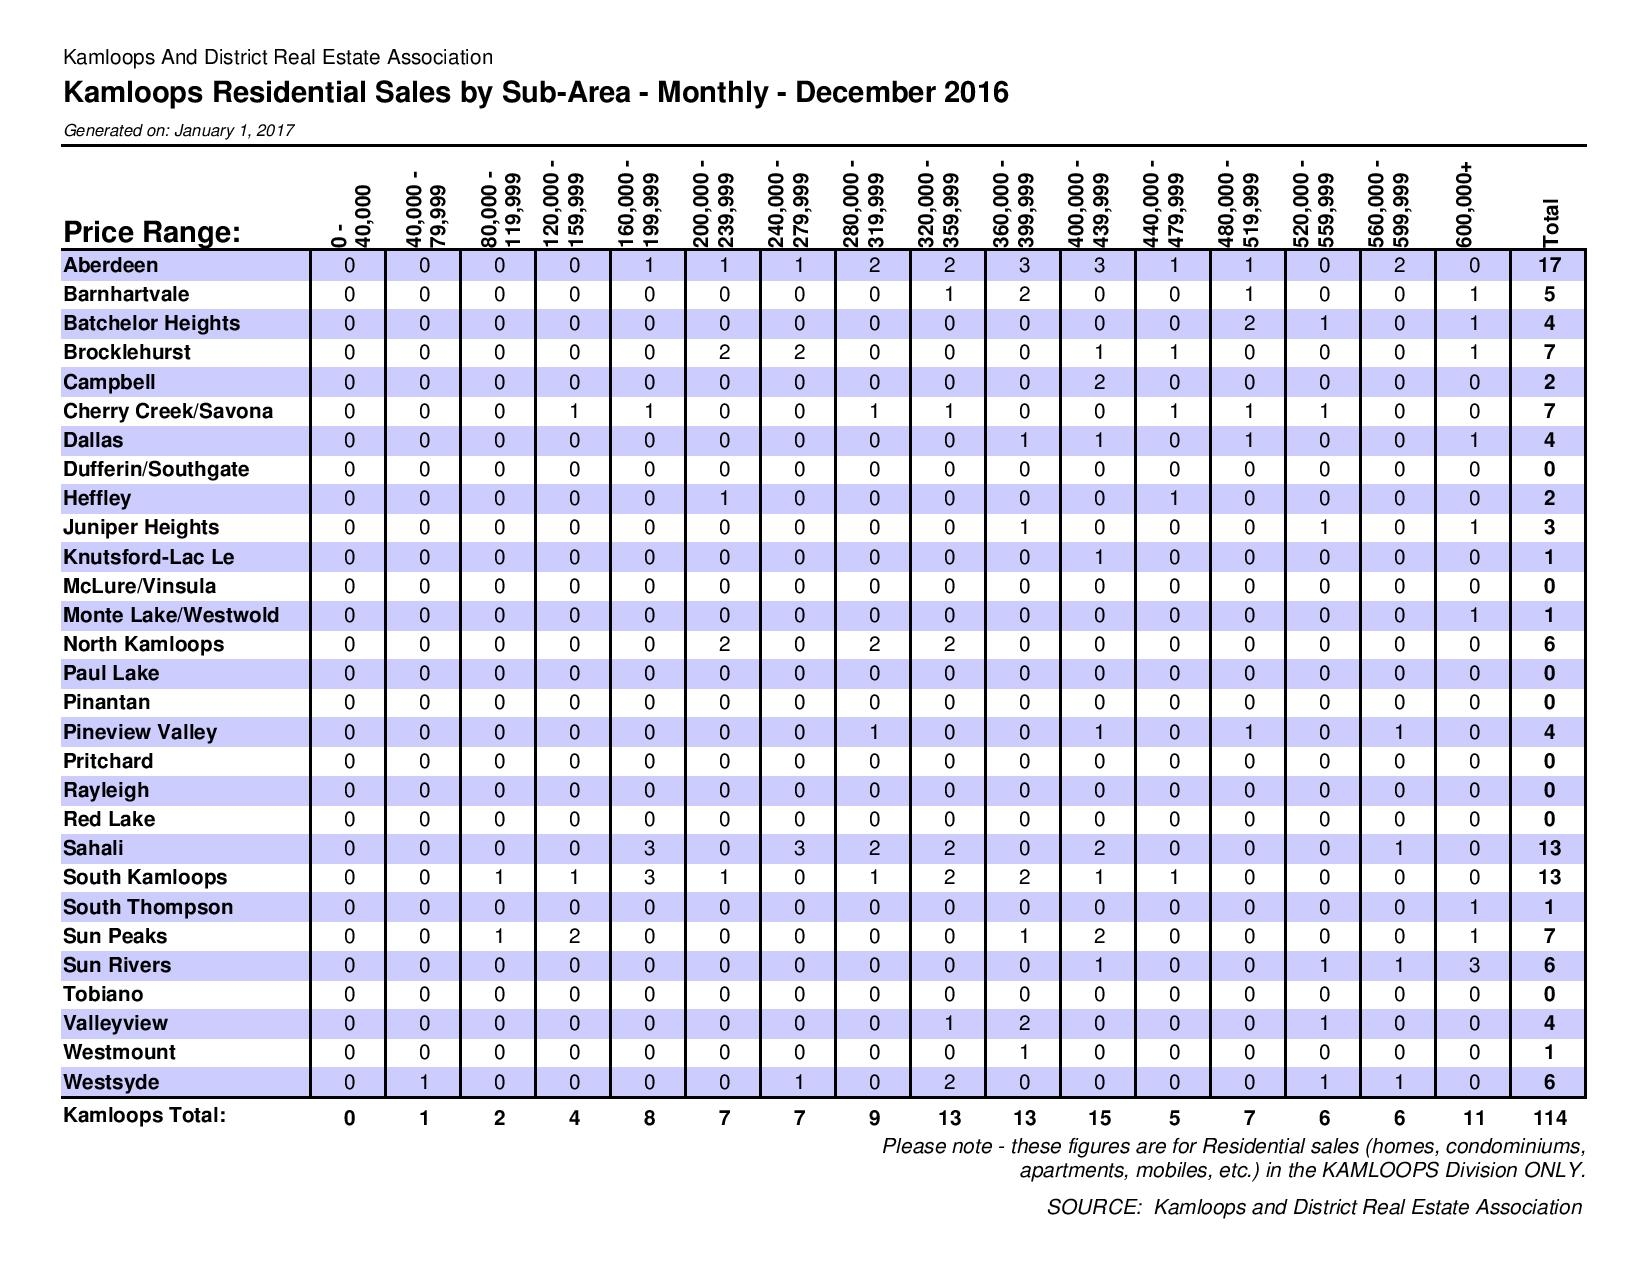
Kamloops District Real Estate Board Sales Statistics:

 “Broad-based consumer demand driven by strong economic conditions, employment growth, consumer confidence, and an expanding population base pushed home sales to record levels in many BC regions last year,” said Cameron Muir, BCREA Chief Economist. “However, home sales have fallen back from their lofty peaks early last year.” The seasonally adjusted annual rate of sales activity was approximately 92,000 units in December.
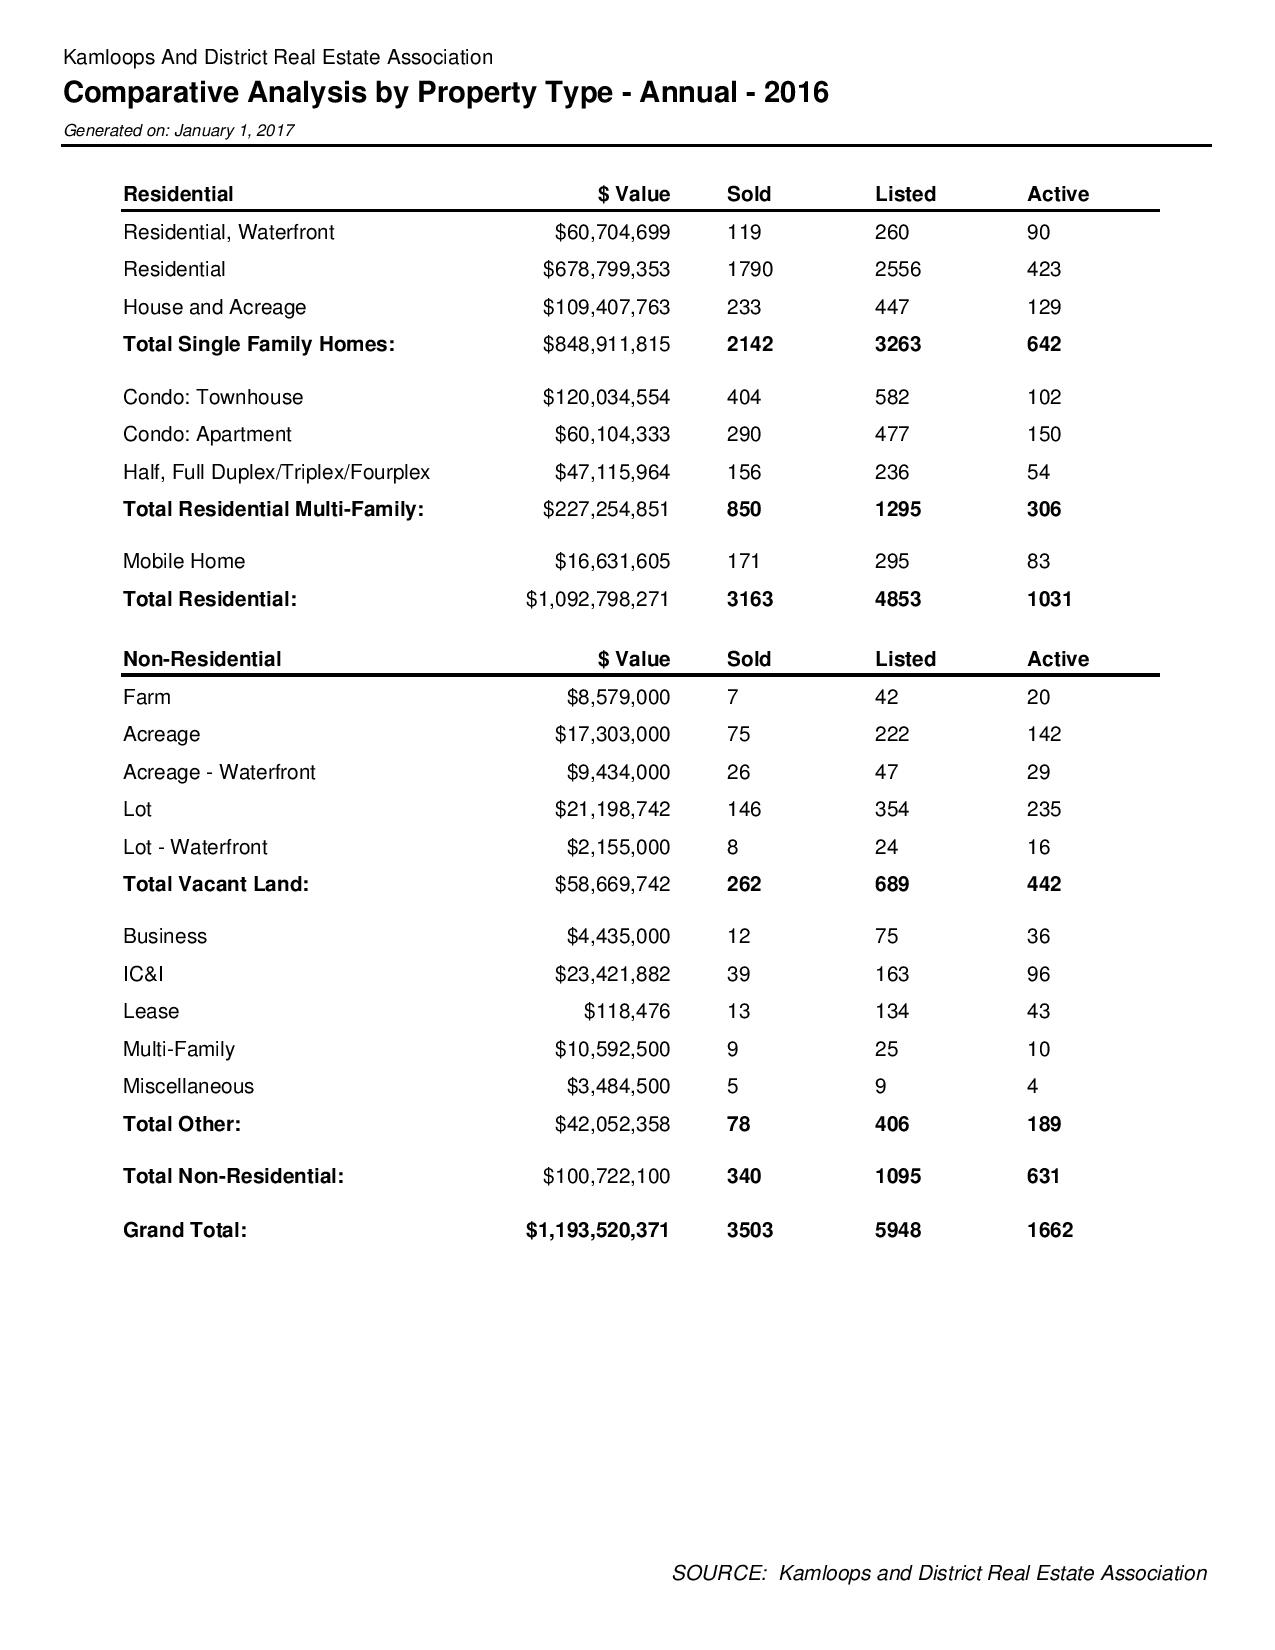


 Kamloops District Real Estate Board Sales Statistics: