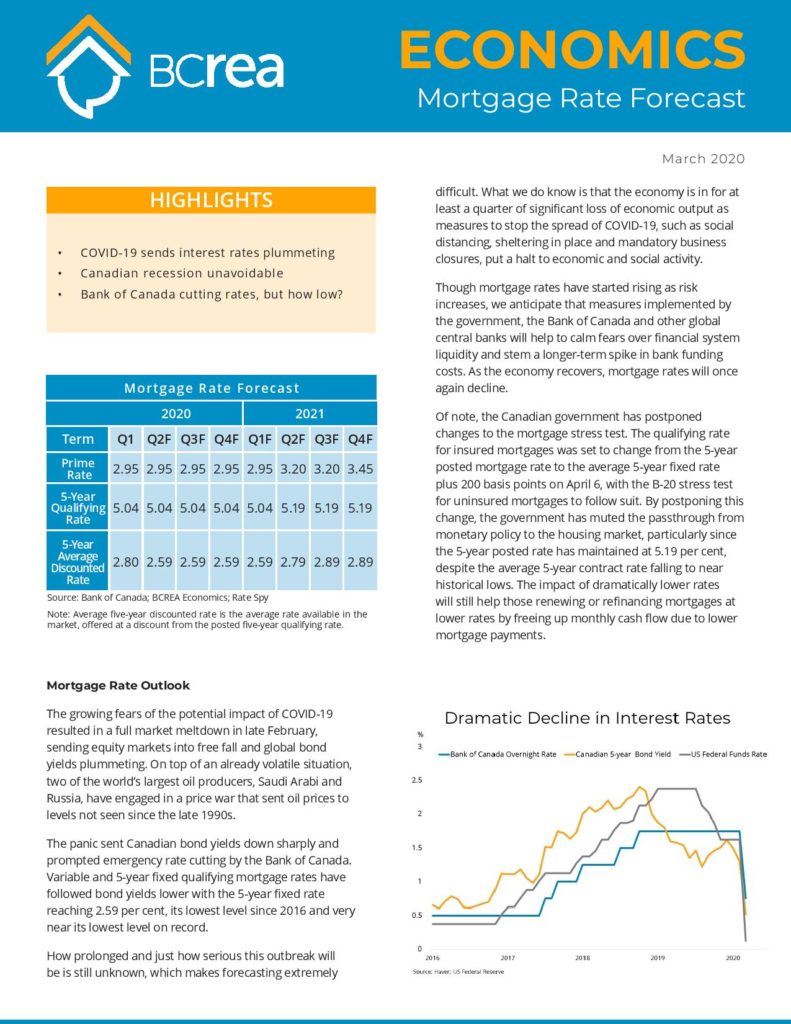
BCREA Mortgage Rate Forecast for March 2020
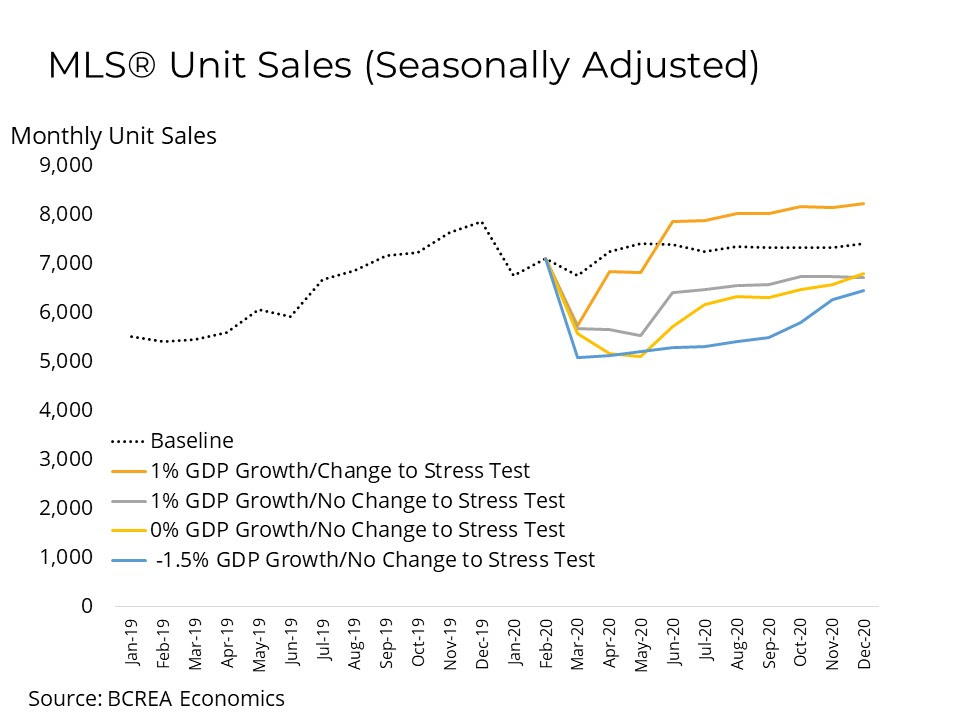
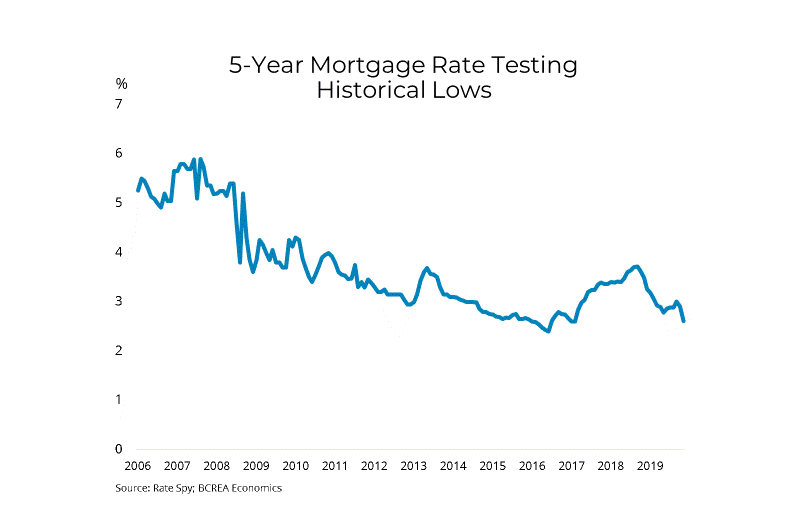
BCREA just released it’s Mortgage Rate Forecast for March and the year of 2020. With the COVID-19 mortgage rates have dropped. The Bank of Canada recently cut the rate again however says it is at a point where it can’t go lower. It is looking like a Canadian recession is unavoidable however it all depends on how long the pandemic related regulations go on for. This is a large factor that prevents accurate predictions since we have not seen an event of this magnitude in decades.
The Canadian government has postponed changes to the mortgage stress test due to the current events. This will help those renewing or refinancing their mortgages which will free up monthly cash flow due to the lower payments.
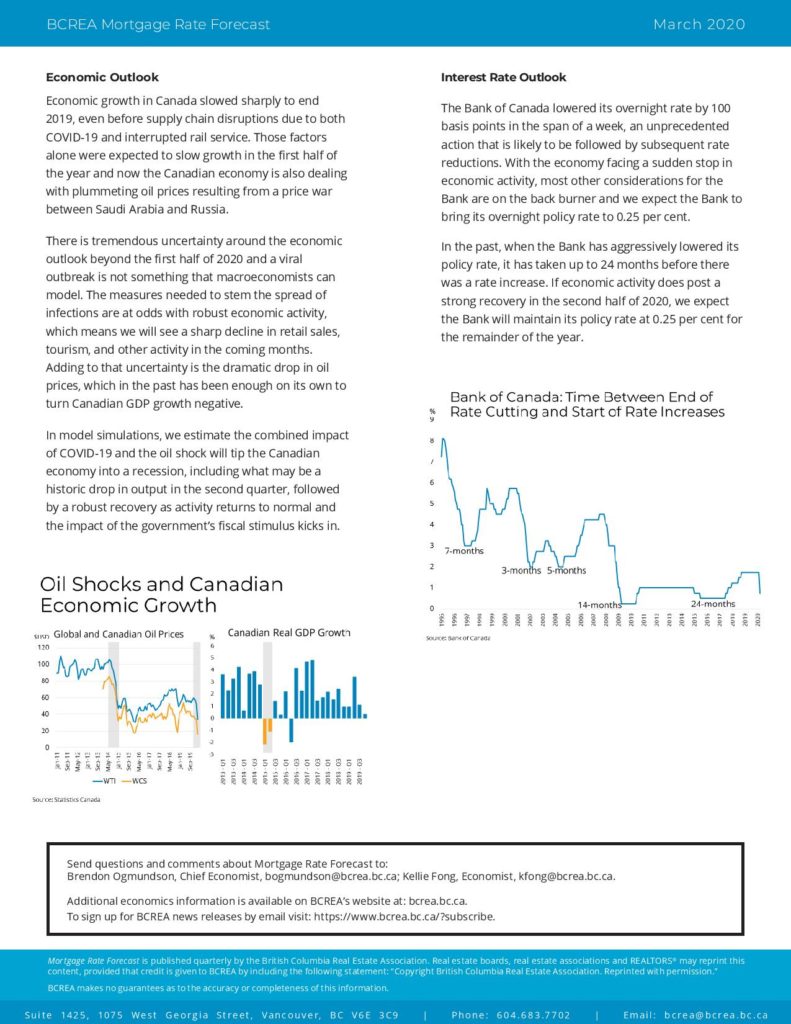
Economic growth in Canada was slowed at the end of 2019 due to the rail blockades and now COVID-19. The economy is also dealing with plummeting oil prices, a sharp decline in retail sales, tourism and other consumer related businesses.
It is expected that if we have a strong recovery in the second half of 2020 the Bank of Canada will likely maintain it’s policy rate at 0.25% for the rest of the year.
Click here to download the full PDF version of this report.
Click here to visit to BCREA’s website. To view other statistics for the Kamloops and BC real estate market click here.