British Columbia’s housing affordability saw noticeable improvements in the fourth quarter of 2012, but it remains the priciest province in which to own a home, the latest Housing Trends and Affordability Report released today by RBC Economics Research shows.
“Affordability improvements across most housing types in the fourth quarter were welcome news to prospective buyers in British Columbia,” said Craig Wright, senior vice-president and chief economist, RBC. “Still, the market has a long way to go before affordability reaches less stressful levels.”
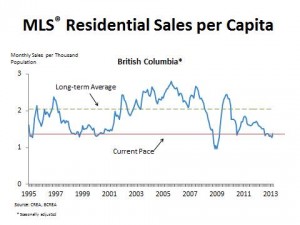
In Metro Vancouver, home resales fell 23 per cent in 2012 to the lowest level in 12 years, excluding the recession of 2008, RBC said. While the RBC report says poor affordability is a key factor behind the 11.9-per-cent drop in home resales in the province in 2012 compared to 2011, other databases offer a more nuanced picture of housing affordability in Metro Vancouver.
The Vancouver Sun introduced the UDI/FortisBC Housing Affordability Index earlier this month to provide a more contextual and in-depth look at housing affordability across Metro Vancouver.
This index found that outside of the city of Vancouver — notably in suburbs like Surrey and Maple Ridge — the housing market remains affordable to people earning average incomes.
The significant differences between the RBC Housing Affordability Measures and The Vancouver Sun UDI/FortisBC Housing Affordability Index is that RBC expresses the percentage of an average income that is required to service the debt on a home and does not separate out the different areas of Metro Vancouver, while the UDI/Fortis Index looks at the percentage of households in a given region that can afford to buy a home in that specific region, using no more than 32 per cent of their income.
“The UDI/FortisBC Housing Affordability Index powered by Urban Analytics provides a better representation of what you can afford to buy and where in Metro Vancouver, because we looked at the different geographic regions separately,” said Michael Ferreira, principal at Urban Analytics, a company that provides research and advisory services for the new home industry.
RBC’s housing affordability measures track the proportion of pre-tax household income needed to service the costs of owning a home at market values — it puts the cost of owning in B.C. at 66.4 per cent of median household incomes for a detached bungalow, 72.7 per cent for a two-storey home and 33.4 per cent for condominiums. These were all down from the previous quarter, except for the two-storey home category, which went up 0.4 per cent after a 3.2 per cent drop last quarter, as prices declined between 0.8 and four per cent across the region.
For Vancouver, the RBC data shows a detached bungalow costs 82.2 per cent of median income, including mortgage payments, utilities and property taxes.
The UDI/FortisBC Housing Affordability Index breaks Metro Vancouver into three areas: the city of Vancouver, Inner Metro (West Vancouver, North Vancouver, Burnaby, New Westminster, Richmond, South Delta, Coquitlam, Port Moody, Port Coquitlam) and Outer Metro (Surrey, Langley, North Delta, White Rock, Pitt Meadows and Maple Ridge).
Splitting the region into three areas means the numbers are not skewed so heavily by the priciest markets like the west side of Vancouver, Ferreira said.
The index shows that the majority of households in outer Metro can afford the payments on all types of homes, both new and resale. It found that as many as 82.9 per cent of households in outer Metro could make the payments on a resale wood-frame condo, while 80.4 per cent could afford a resale concrete condo.
For inner Metro, the index found that while 64.5 per cent of working households can afford a resale wood-frame condo, just 51.7 per cent of working households can afford a new concrete condo and less than 40.9 per cent of households could afford a single-family home.
In Vancouver proper, the UDI/FortisBC Affordability Index shows that housing is affordable for a far smaller percentage of the population — fewer than 32 per cent of households can afford payments on a single-family home, a new or resale townhouse or a new concrete condominium
By Tracy Sherlock, Vancouver Sun
Link


