British Columbia Real Estate Associations MLS® Transaction Sales Statistics For B.C.: 2nd Quarter of 2010

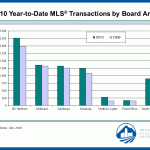
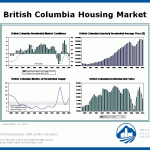
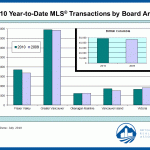
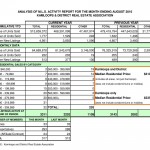
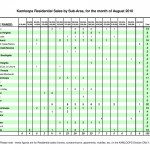
The British Columbia Real Estate Association released sales statistics from all B.C. Real Estate boards comparing the MLS® transaction volumes for 2009 and 2010. I have included all charts including the larger Real Estate board areas for the sake of comparison. Click on the image to enlarge.

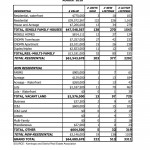
Kamloops Housing Market 2010 vs. 2009 sales MLS transactions by Board Area Statistics Information

Kamloops Real Estate MLS Transaction Volume and Statistics by Board Area

BC Housing Market 2010 Quarter 2 charts statistics Information

BC Housing Market 2nd Quarter 2010 MLS Transaction Sales Statistics

2010 Year To Date MLS Transactions By Board Area Statistics 2nd Quarter Larger Real Estate Board Area

2010 Year To Date MLS Transactions By Board Area Statistics 2nd Quarter Larger Real Estate Board Area

Link

BC Real Estate Association: Home Buyers Are In The Drivers Seat In 2010

This article was released by the British Columbia Real Estate Association mid-August 2010. There are a number of graphs and sales data in the original document including Kamloops specific information. To view the original document (link removed). I have included the basic information below.

The British Columbia Real Estate Association (BCREA) reports that Multiple Listing Service® (MLS®) residential sales in the province declined 42 per cent to 5,784 units in July compared to the same month last year. On a seasonally adjusted basis, MLS® residential unit sales in the province declined 19 per cent in July from June 2010. The average MLS® residential price climbed 6 per cent to $491,832 in July compared to the same month last year.

“A relatively large number of homes for sale have created the most favourable supply conditions for home buyers in more than a year,” said Cameron Muir, BCREA Chief Economist. MLS® active residential listings were 21 per cent higher in July than at the start of the year on a seasonally adjusted basis. However, with newly listed MLS® residential units now declining, tighter market conditions may emerge this fall.

Year-to-date, BC residential sales dollar volume increased 16 per cent to $24.2 billion, compared to the same period last year. Residential unit sales rose 4 per cent to 48,127 year-to-date, while the average MLS® residential price climbed 13 per cent to $504,281 over the same period.

BCREA

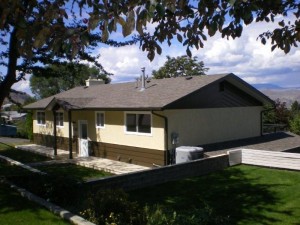
Featured Property: 526 West Battle Street, South Kamloops West End, B.C. $414,900

Kamloops Home For Sale 526 Battle Street

This home is centrally located in the South Kamloops West End, has a 2 bedroom inlaw suite and is close to shopping, transportation and TRU. Everything in this home has been updated, new roof, heat pump, furnace, hot water tank, paint inside & out, all flooring, kitchen appliances (stainless upstairs, white down), all windows, patios, insulation in the attic, bathrooms and the list continues. The two bedroom suite is very inviting and bright. There is a beautiful panoramic valley and river view from the main floor. Oversized windows make this home very bright. There are two 4 piece bathrooms and a 2 piece ensuite. The ensuite can easily be converted to a 3 piece. There is a two car tandem carport with tons of extra storage in the insulated storage room. The large yard it great for a growing family and there is RV parking. Book your appointment to view this home, it won’t last!

To view all homes for sale in Kamloops click here.

1 729 730 731 732 733 776