I find these Kamloops market statistics quite interesting. They give us a good feel for what is happening in the local market in a relevant time frame. Each neighbourhood of Kamloops is very different from each other. Some neighbourhoods are experiencing quick sales and high ratios of sale to list price. Others unfortunately have had to deal with reducing the ask price to get the property sold.
The highest list to sell ratio of Single Family type listings in Kamloops, within the last 7 months is 1.100.
In the Juniper Heights area, the highest price per square foot of new Single Family type listings within the last month is $160.45.
The average sale price of Lots/acreage type listings in the South Kamloops area, within the last 9 months is $225,750.00.
The average sale price of Single Family type listings in the Batchelor Heights area, within the last 9 months is $441,927.
The average sale price of Single Family type listings in the Batchelor Heights area, within the last month is $405,250.00.
In the Valleyview area, the highest price per square foot of new Townhouse type listings within the last 6 months is $201.17.
The highest sale price of Single Family type listings in the Aberdeen area, within the last 6 months is $668,000.00.
The average sale price of Lots/acreage type listings in the Cherry Creek/Savona area, within the last 8 months is $143,000.00.
40.91% of Townhouse type listings put on the market in the South Kamloops area, within the last 8 months have actually sold.
The highest sale price of Townhouse type listings in the Juniper Heights area, within the last 10 months is $333,000.00.
The average list to sell ratio of Single Family type listings in the Cherry Creek/Savona area, within the last 2 months is 0.966.
The highest sale price of Single Family type listings in the Sahali area, within the last 5 months is $775,000.00.
The highest sale price of Single Family type listings in the Knutsford-Lac Le Jeune area, within the last 5 months is $760,500.00.
In the Westmount area, the average home price per square foot of new Single Family type listings within the last 11 months is $171.02.
50.00% of Single Family type listings put on the market in the Westmount area, within the last 11 months have actually sold.
The highest sale price of Single Family type listings in the Pineview Valley area, within the last 8 months is $690,000.00.
499 Single Family type listings in Kamloops, have had at least two price drops within the last year.
The average sale price of Townhouse type listings in the Brocklehurst area, within the last 11 months is $200,995.80.
The average sale price of Single Family type listings in Kamloops, within the last 9 months is $399,551.13.
In the Juniper Heights area, the highest price per square foot of new Townhouse type listings within the last 5 months is $165.18.
The highest list to sell ratio of Townhouse type listings in the Aberdeen area, within the last 3 months is 0.987.
The highest list to sell ratio of listings in the Valleyview area, within the last year is 1.037.
In the Sun Rivers area, the average home price per square foot of new Single Family type listings within the last 10 months is $216.73.
Happy Easter! I have compiled a list of some interesting Kamloops Real Estate facts and statistics. Have a great weekend.
In the Pineview Valley area, the average home price per square foot of new Single Family type listings within the last 4 months is $238.53.
In the McLure/Vinsula area, the average home price per square foot of new Single Family type listings within the last 11 months is $157.22.
In the Aberdeen area, the highest price per square foot of new Single Family type listings within the last 3 months is $232.63.
51.71% of Single Family type listings put on the market in the Westsyde area, within the last 11 months have actually sold.
In the South Kamloops area, the average home price per square foot of new Single Family type listings within the last 2 months is $180.99.
The average list to sell ratio of Single Family type listings in the Pineview Valley area, within the last 2 months is 0.988.
The average list to sell ratio of Townhouse type listings in the Juniper Heights area, within the last 11 months is 0.979.
The average list to sell ratio of Single Family type listings in the McLure/Vinsula area, within the last 9 months is 0.923.
In the Knutsford-Lac Le Jeune area, the average home price per square foot of new Single Family type listings within the last 11 months is $257.66.
34.38% of Townhouse type listings put on the market in the Sahali area,within the last 6 months have actually sold.
The highest sale price of Townhouse type listings in the Batchelor Heights area, within the last month is $308,500.00.
In the Sahali area, the average home price per square foot of new Single Family type listings within the last 9 months is $178.37.
23.08% of Single Family type listings put on the market in the South Thompson Valley area, within the last 11 months have actually sold.
59.05% of Single Family type listings put on the market in the South Kamloops area, within the last 11 months have actually sold.
The average sale price of Single Family type listings in the North Kamloops area, within the last 4 months is $286,665.63.
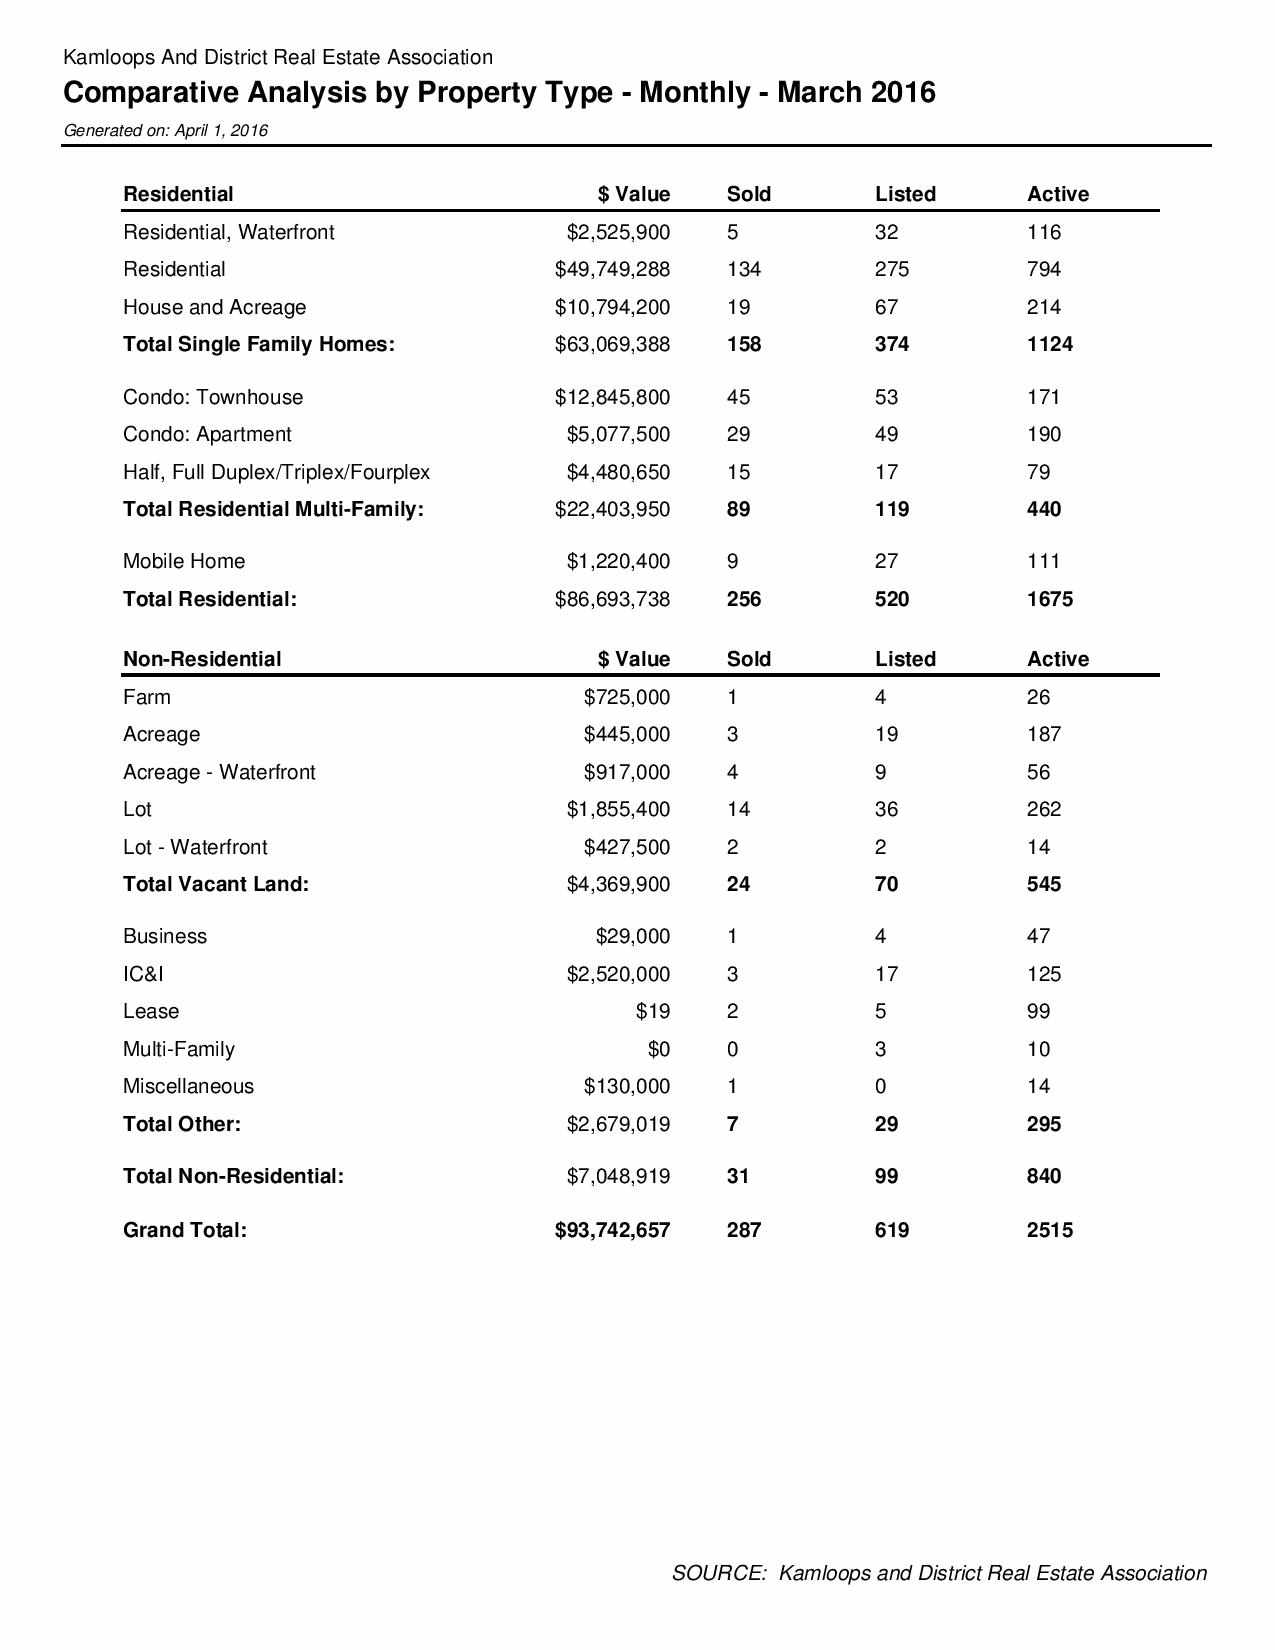
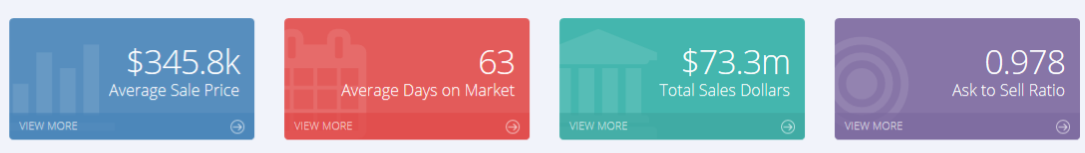
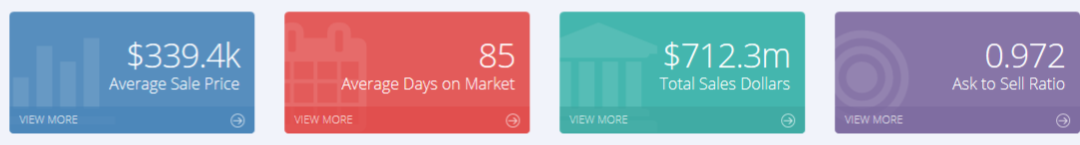
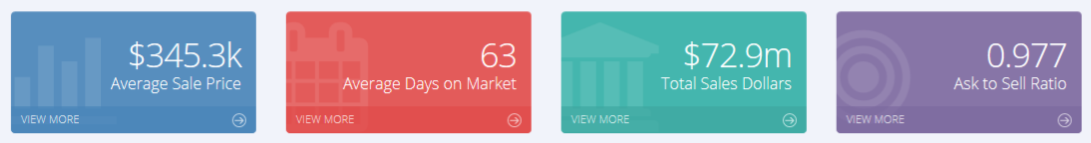
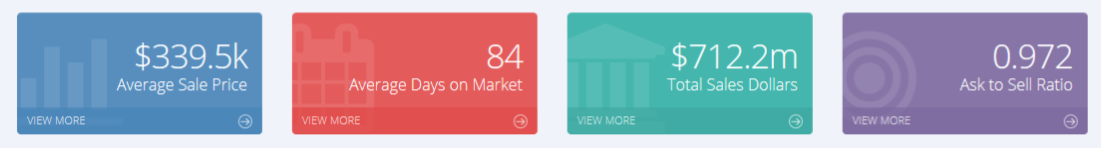
Currently homes are selling at a brisk pace in Kamloops. There are a few specific areas of Kamloops that are seeing multiple offers and quick sales. Currently our team is selling homes faster and for more money than our real estate board average. See images below:
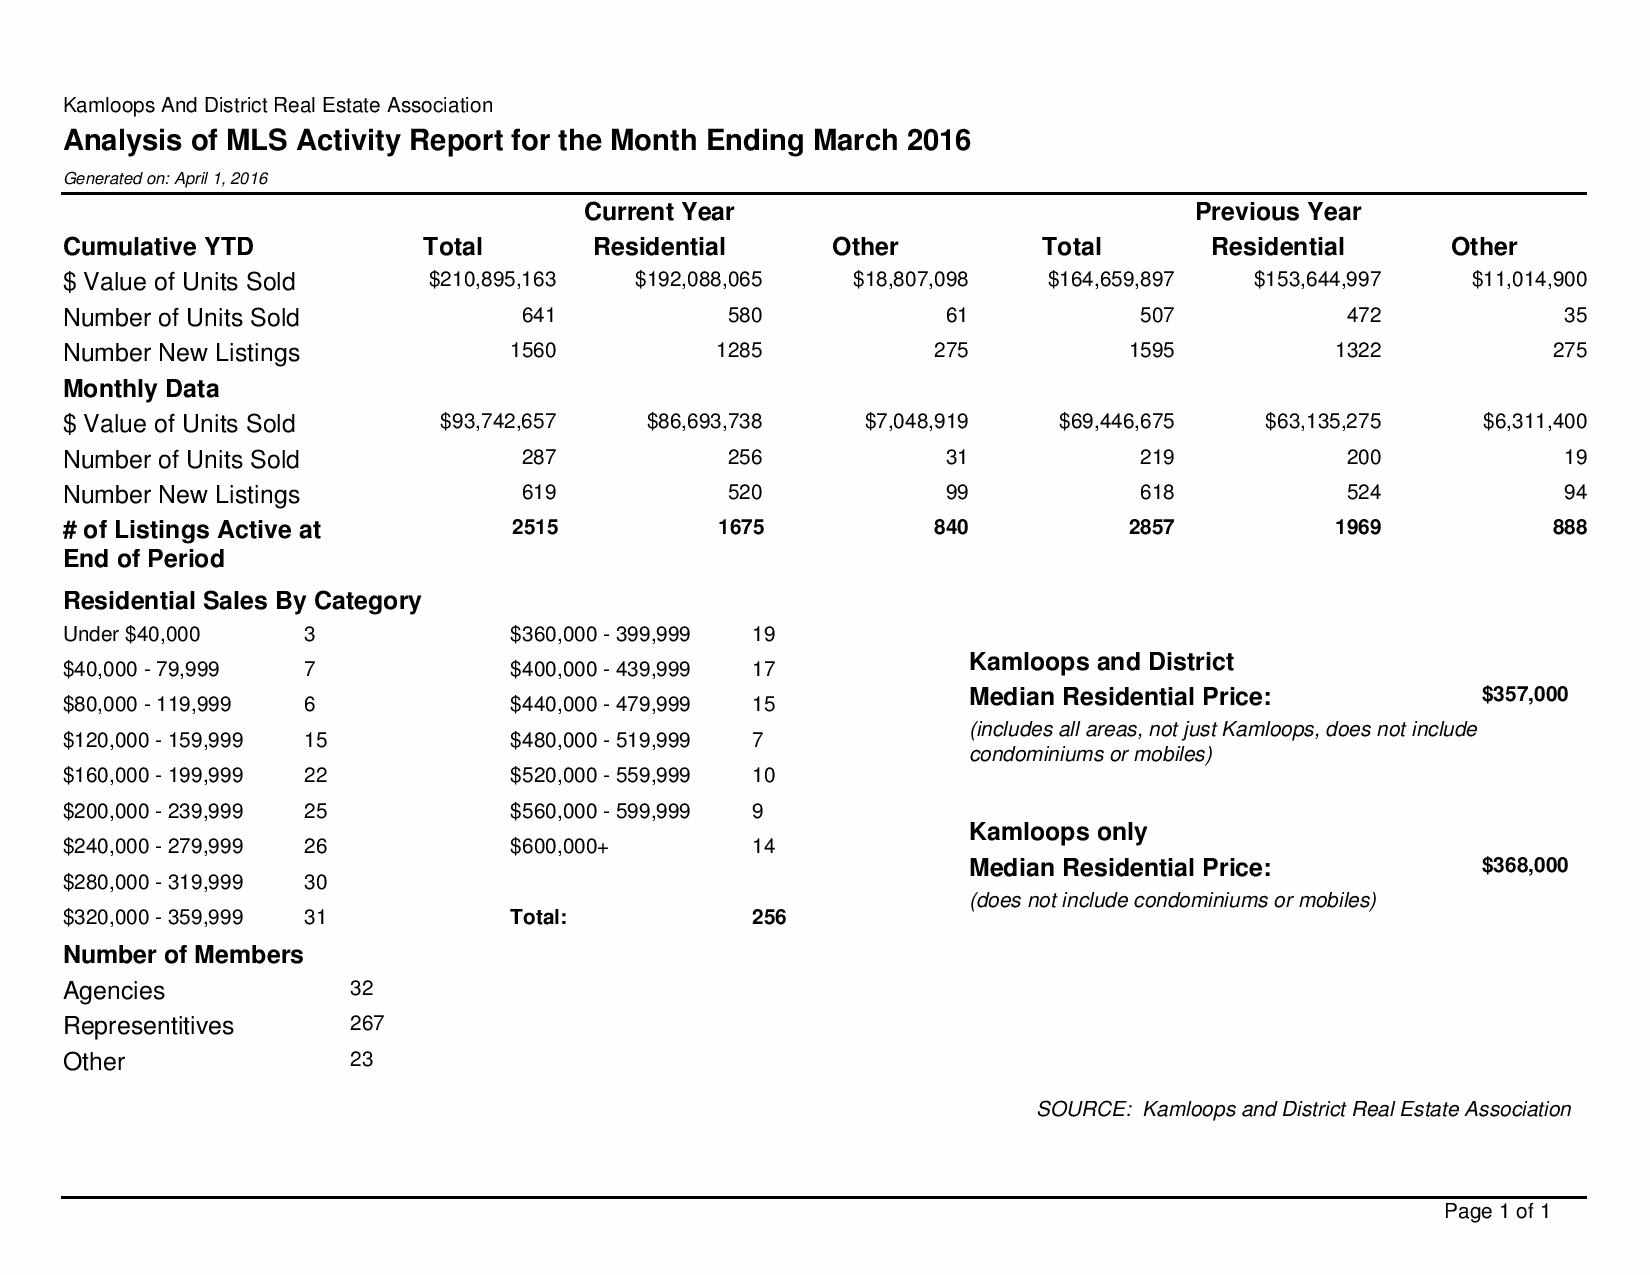
I was reviewing some of the most recent statistics for the Kamloops area and I came upon these interesting facts about our market currently.
In the Westmount area, the highest price per square foot of new Single Family type listings within the last 2 months is $138.55.
The average sale price of Single Family type listings in the North Kamloops area, within the last 6 months is $290,351.79.
The average list to sell ratio of listings in the Aberdeen area, within the last month is 0.972.
51.18% of Single Family type listings put on the market in the North Kamloops area, within the last 10 months have actually sold.
The highest list to sell ratio of Single Family type listings in the Batchelor Heights area, within the last 2 months is 0.989.
In the Brocklehurst area, the average home price per square foot of new Townhouse type listings within the last year is $162.18.
The highest sale price of Single Family type listings in the South Kamloops area, within the last 7 months is $748,000.00.
In Kamloops, the highest price per square foot of new Single Family type listings within the last 4 months is $418.63.
In the Dufferin/Southgate area, the highest price per square foot of new Single Family type listings within the last 2 months is $159.72.
The average list to sell ratio of Single Family type listings in the Aberdeen area, within the last 10 months is 0.979.
Currently homes are selling at a brisk pace in Kamloops. There are a few specific areas of Kamloops that are seeing multiple offers and quick sales. Currently our team is selling homes quicker and for more money than our real estate board average. See images below: