Kamloops MLS Residential Sales by Sub-Area, for the month of September 2008

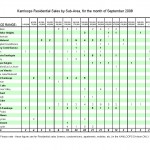
Here is the latest Kamloops MLS Residential Sales by Sub-Area, for the month of September 2008. Published by the Kamloops and District Real Estate Association. This chart will help you see how many residential properties have sold in a given neighbourhood and the price range it sold in. The type of property is not displayed in this chart. Look at the Kamloops Real Estate, Comparative Analysis by Property Type for September, 2008 post found here: Link

kamloops-residential-mls-sales-by-sub-area-for-the-month-of-september-2008-pdf

Kamloops Residential MLS Sales by Sub-Area, for the month of September 2008

Kamloops Residential MLS Sales by Sub-Area, for the month of September 2008

Kamloops Real Estate, Comparative Analysis by Property Type, September, 2008.

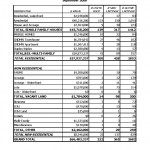
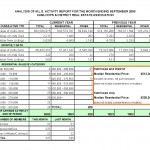
Here is the latest Kamloops Real Estate, Comparative Analysis by Property Type for September, 2008. Supplied by the Kamloops & District Real Estate Association. With this chart you can get an idea of what property types are: Active listings, newly listed, # of units sold and the value of those units. These totals are down a bit from last month.

A quick summary for total residential active, new and sold listing for September 2008 for Kamloops and surrounding areas:

Residential # of active listings 1853
Residential # of new listings 428
Residential # of sold listings 200
Value of sold units $57,937,337

kamloops-comparative-analysis-by-property-type-september-2008 pdf

Kamloops Real Estate MLS Listings Comparative Analysis by Property Type, September, 2008

Kamloops Real Estate MLS Listings Comparative Analysis by Property Type, September, 2008

1 25 26 27