Provincial Housing Market Activity Normalizing into 2022

BCREA 2022 First Quarter Housing Forecast Update

Vancouver, BC – February 2, 2022. The British Columbia Real Estate Association (BCREA) released its 2022 First Quarter Housing Forecast Update today.

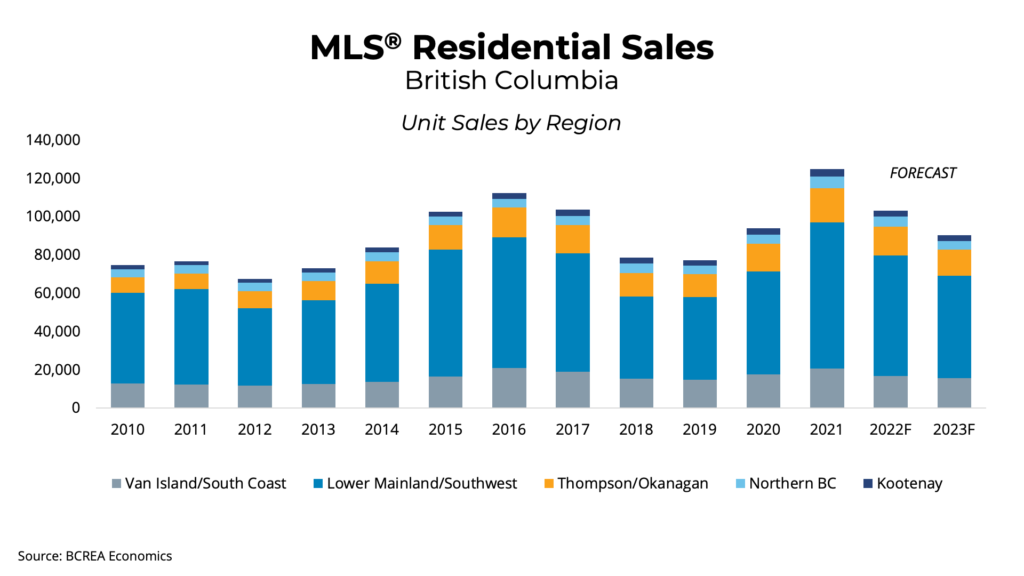
Multiple Listing Service® (MLS®) residential sales in the province are forecast to decline 17 per cent from a record high 2021 to 103,250 units this year. In 2023 MLS® residential sales are forecast to fall an additional 12 per cent to 90,200 units.

“We expected home sales in 2022 do moderate from the frenetic pace of 2021,” said BCREA Chief Economist Brendon Ogmundson. “However, sales activity will remain high by historical standards.”

The BC housing market is entering 2022 with the lowest level of active listings on record and significant demand-side momentum. That means strong sales should persist through the first few months of the year and supply will remain severely limited. As a result, continued upward pressure on home prices is expected in all markets.

As a result, home prices are expected to rise by 8.5 per cent in 2022 with much of that gain happening in the first half of the year. With sales activity normalizing in 2023 and inventories rebuilding, market conditions around the province should improve and price growth is anticipated to slow to 2.7 per cent.

Click here to visit to BCREA’s website. To view other statistics for the Kamloops and BC real estate market click here.

If you want to be kept informed on Kamloops Real Estate, News and more visit our Facebook Page.

To search for Kamloops real estate and homes for sale click here.

BCREA Housing Market Update for January 2022

BCREA has released it’s latest housing market update for January 2022 which discusses December 2021 statistics and the 2021 sales. 2021 was a record year for the BC housing market with home sales reaching 124,854 sales, surpassing the previous record of 112,425 in 2016. Seven different markets in BC set sales records for 2021. Provincial home sales for December were down 17.6% year over year. Listing activity has remained low resulting in 2022 beginning with the lowest level of active listings on record. There were just over 12,000 active listings in BC which is down 41% from one year ago. With a low number of listings, markets around BC are under pressure pushing the markets far into Seller’s market territory. The MLS average price for BC was up 22.7% year over year in December and passed the one million mark for the first time ($1,033,179). For 2021 the average home price was about $928,000.

For Kamloops there were 159 unit sales for the month of December which is a 33.2% decline year over year. The average price was $631,657 which is a 33.8% increase year over year. Kamloops finished with an active listing count of 375 which is 61.3% less than the previous year which equates to 2.4 months worth of supply. We have seen very few homes list for sale in January leading to multiple offers on properties. This has resulted in sales being reported well over the asking price. There doesn’t seem to be an end in sight at this time however with more listing inventory it should help ease the pressure on home buyers.

Click here to visit to BCREA’s website. To view other statistics for the Kamloops and BC real estate market click here.

If you want to be kept informed on Kamloops Real Estate, News and more visit our Facebook Page.

To search for Kamloops real estate and homes for sale click here.

Kamloops District Real Estate Associations Statistics For December 2021

The Kamloops District Real Estate Association has released the latest Statistics for December 2021. Click on the image below to enlarge or PDF documents included in the links below.

Comparative Analysis - December 2021, Kamloops and District Real Estate Statistics

PDF: Comparative Analysis – December 2021

Comparative Analysis - Annual 2021, Kamloops and District Real Estate Statistics

PDF: Comparative Analysis – Annual 2021

MLS Activity - December 2021, Kamloops and District Real Estate Statistics

PDF: MLS Activity – December 2021

Sales by Sub Area - December 2021, Kamloops and District Real Estate Statistics

PDF: Sales by Sub-Area – December 2021

Sales by Sub Area - Quarter 4 2021, Kamloops and District Real Estate Statistics

PDF: Sales by Sub-Area – Quarter 4 2021

Sales by Sub Area - Annual 2021, Kamloops and District Real Estate Statistics

PDF: Sales by Sub-Area – Annual 2021

Sales by Sub-Area Out of Town - December 2021, Kamloops and District Real Estate Statistics

PDF: Sales by Sub-Area Out of Town – December 2021

Sales by Sub-Area Out of Town - Quarter 4 2021, Kamloops and District Real Estate Statistics

PDF: Sales by Sub-Area Out of Town – Quarter 4 2021

Sales by Sub-Area Out of Town - Annual 2021, Kamloops and District Real Estate Statistics

PDF: Sales by Sub-Area Out of Town – Annual 2021

For Previous Monthly, Quarterly & Annual Statistics click here.

To View our current listings click here.

Kamloops District Real Estate Associations Statistics For November 2021

The Kamloops District Real Estate Association has released the latest Statistics for November 2021. Click on the image below to enlarge or PDF documents included in the links below.

MLS Activity - November 2021, Kamloops and District Real Estate Statistics

PDF: MLS Activity – November 2021

Comparative Analysis - November 2021, Kamloops and District Real Estate Statistics

PDF: Comparative Analysis – November 2021

Sales by Sub Area - November 2021, Kamloops and District Real Estate Statistics

PDF: Sales by Sub-Area – November 2021

Sales by Sub Area Out of Town - November 2021, Kamloops and District Real Estate Statistics

PDF: Sales by Sub-Area Out of Town – November 2021

For Previous Monthly, Quarterly & Annual Statistics click here.

To View our current listings click here.

1 17 18 19 20 21 105